
To evaluate the influence of sub-minimum inhibitory concentrations (MICs) of ciprofloxacin (CIP) on biofilm formation and virulence factors of Escherichia coli clinical isolates.
MethodsSub-MICs of CIP were determined using growth curve experiments. The biofilm-forming capacity of E. coli clinical isolates and E. coli ATCC 25922 treated or untreated with sub-MICs of CIP was assessed using a crystal violet staining assay. The biofilm structure of E. coli isolate was assessed with scanning electron microscopy (SEM). The expression levels of the virulence genes fim, usp, and iron and the biofilm formation genes of the pgaABCD locus were measured using quantification RT-PCR (qRT-PCR) in E. coli isolates and E. coli ATCC 25922.
ResultsBased on our results, the sub-MICs of CIP were 1/4 MICs. Sub-MICs of CIP significantly inhibited biofilm formation of E. coli clinical isolates and E. coli ATCC 25922 (p<0.01). SEM analyses indicated that the biofilm structure of the E. coli changed significantly after treatment with sub-MICs of CIP. Expression levels of the virulence genes fim, usp, and iron and the biofilm formation genes of the pgaABCD locus were also suppressed.
ConclusionsThe results revealed that treatment with sub-MICs of CIP for 24h inhibited biofilm formation and reduced the expression of virulence genes and biofilm formation genes in E. coli.
Escherichia coli is a common cause of parenteral infections, including urinary tract infections, neonatal meningitis, Gram-negative bacteremia, and prostatitis.1,2 The occurrence of these infections is mainly dependent on the immune status of the host as well as on bacterial factors.2 The pathogenicity of E. coli is mainly related to its virulence factors, which are associated with host colonization and invasion, tissue damage, stimulation of inflammatory response, evasion of immune response, and biofilm formation. According to previous research, virulence factors include genes encoding iron acquisition systems (iron, iuc), adhesins (fim, afaI, sfa, iha), toxins (cnf1, hlyA, set, astA, usp), and biofilms (pgaABCD).3,4
Antibiotic therapy is of great importance for treating bacterial infections. Ciprofloxacin (CIP) is a second-generation fluoroquinolone antibiotic widely used to treat Gram-negative and Gram-positive bacterial infections. CIP is a first-line medication for various infections,5 and is the most commonly used fluoroquinolone for the treatment of urinary tract infections, as it can be readily absorbed from the gastrointestinal tract after oral administration.6 Other advantages of CIP include broad-spectrum coverage and high urinary excretion rates.6In vivo, supra-inhibitory concentrations of antibiotic inevitably become sub-minimum inhibitory concentrations (MICs) once inside the body.7
Reports on the impacts of sub-MICs of antibacterial drugs on bacteria have been contradictory. In 1988, Schadow et al.8 demonstrated that sub-MICs of rifampin could induce biofilm formation by Staphylococcus epidermidis. However, recent reports have shown that sub-MICs of various antimicrobial agents have both inhibitory and stimulatory effects on E. coli biofilm formation in human infections.9,10 Therefore, it is of clinical interest to broaden our current knowledge of the effects of sub-MICs of antimicrobial agents on biofilms formed by E. coli strains.9 There have been few studies on the influence of sub-MICs of CIP on E. coli biofilm formation. In addition, there is limited information and experimental evidence of the effects of sub-MICs of antimicrobials on the virulence of E.coli. Therefore, the present study was designed to evaluate the effects of sub-MICs of CIP on biofilm formation and virulence factors of E. coli.
2Materials and methods2.1Bacterial strains and susceptibility testingFive CIP-resistant E. coli clinical isolates (DC3233, DC3298, DC3316, DC3362, DC3365) and three CIP-sensitive E. coli clinical isolates (DC3220, DC3224, DC3242) were collected from patients of the First Affiliated Hospital of Wenzhou Medical University, Wenzhou, Zhejiang Province, China in 2015. Among them, DC3220, DC3298, DC3316, DC3362, DC3365 and DC3242 were isolated from different patients with urinary tract infections, DC3224 was isolated from a patient with pyelonephritis, and DC3233 was isolated from a patient with kidney stones. Identification and antimicrobial susceptibility testing were conducted on all isolates using a VITEK 2 system (bioMérieux, Marcy L’Etoile, France). The MICs of CIP were determined using the agar dilution method recommended by the Clinical and Laboratory Standards Institute (CLSI) guidelines.11E. coli ATCC 25922 served as the control strain.
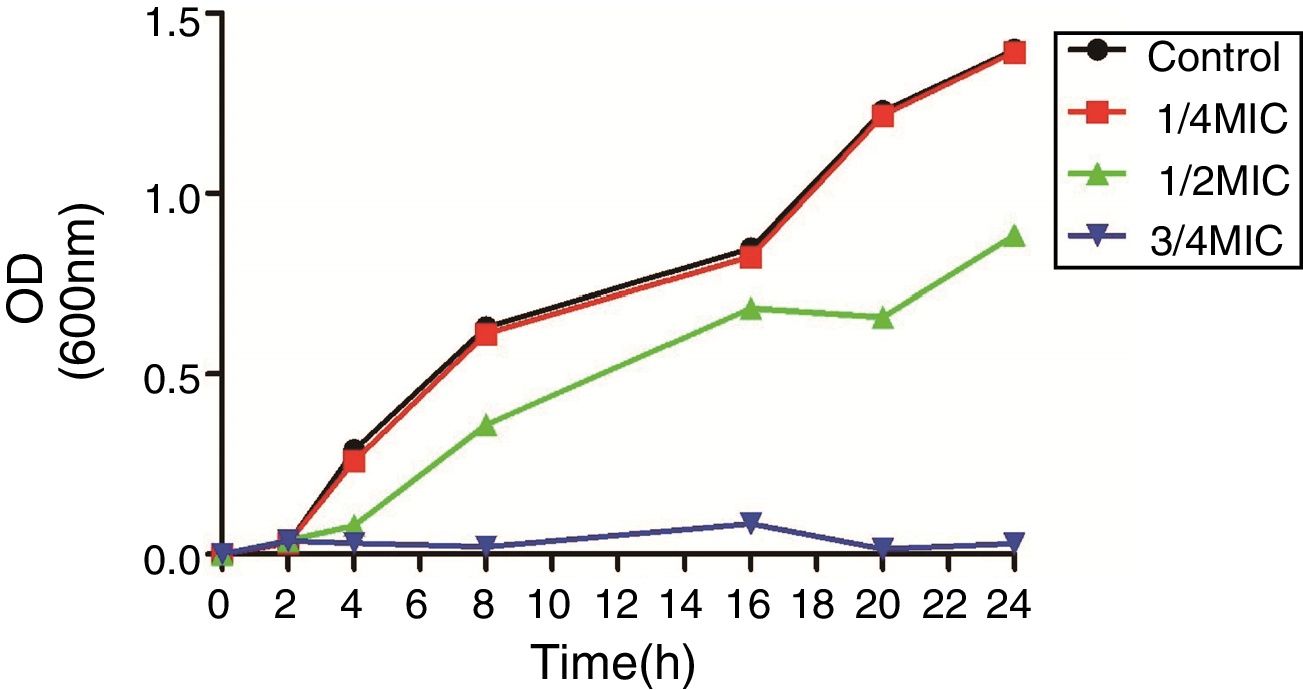
2.2Growth curve experimentsThe sub-MIC of CIP for all further experiments was selected by creating a growth curve. Briefly, E. coli ATCC 25922 was grown in the presence or absence of 0, 3/4, 1/2, 1/4 MIC of CIP.12 Samples were collected at specific time intervals and the absorbance was read at 600nm.
2.3Effect of sub-MICs of CIP on biofilm formationThe static biofilm assay was performed as described previously.7,13 Briefly, eight E. coli clinical isolates and E. coli ATCC 25922 were grown overnight in Luria-Bertani (LB) broth with or without their sub-MIC of CIP. The overnight culture of cells was then diluted 1:100 of fresh LB broth with or without sub-MIC of CIP. A total of 150μL of each dilution was added to a 96-well polystyrene microtiter plate with three replicates and incubated at 37°C for 24h. After incubation, planktonic cells were removed from the wells. After washing three times with sterile water, the wells were stained with 0.1% crystal violet for 10min and the unbound stain was washed three times with sterile water. This was followed by extracting the cell-bound dye with 200μL 95% ethanol and measuring the absorbance of the solution at 600nm using a microplate reader. Each test was repeated three times.
2.4Scanning electron microscopy (SEM) characterization of E. coli biofilmsTo observe and characterize E. coli biofilms, an E. coli ATCC 25922 biofilm was prepared in a six-well microtiter plate as described previously.14 Each well of the treated biofilm group contained 1mL LB medium with sub-MIC of CIP and 1mL overnight culture of E. coli ATCC 25922. Control wells contained 1mL LB medium and 1mL overnight culture of E. coli ATCC 25922. After 24h of cultivation at 37°C, the samples were fixed with 2.5% glutaraldehyde. Ethanol was then used for gradient dehydration of the samples, followed by drying at room temperature. Finally, the processed samples were sputter-coated with gold and viewed using scanning electron microscopy (SEM) at the Laboratory of Analytical Electron Microscopy at Wenzhou Medical University. The voltage was set at 15kV and samples were viewed at a magnification of 2000×.
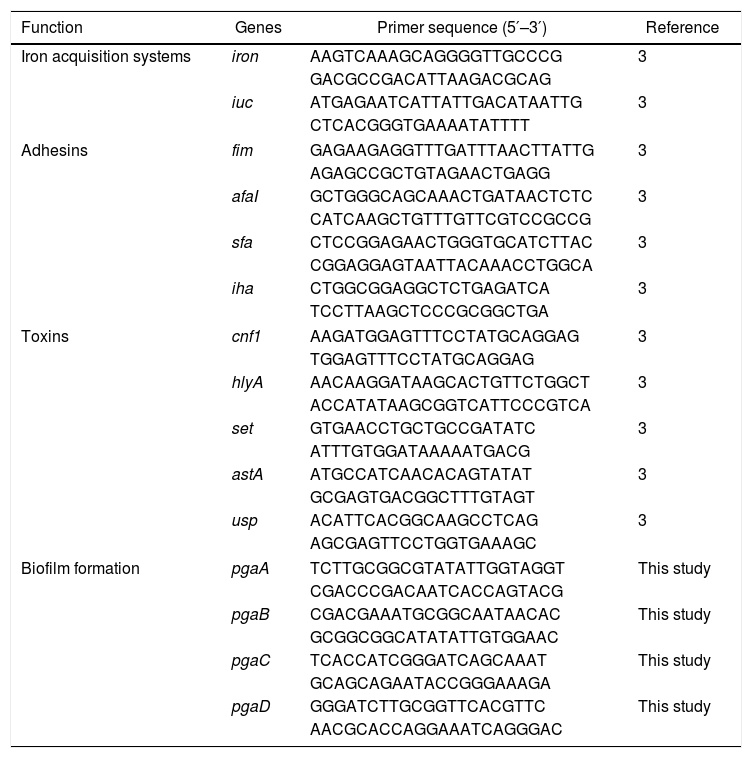
2.5Quantitative reverse transcription PCR (qRT-PCR)The effects of sub-MICs of CIP on the expression levels of E. coli virulence and biofilm formation genes were evaluated using quantitative reverse transcription PCR (qRT-PCR). For RNA isolation, E. coli isolates were grown in fresh LB medium with or without sub-MICs of CIP at 37°C for 24h. Total RNA was extracted from 3mL of culture using an RNeasy Mini Kit (Qiagen, Valencia, CA, USA) according to the manufacturer's instructions. The extracted RNA samples were stored at −80°C. Purified RNA was reverse transcribed into cDNA for qRT-PCR analysis using a cDNA synthesis kit (TaKaRa, Tokyo, Japan) according to the manufacturer's instructions.14,15 Gene expression levels were measured with qRT-PCR using a 7500 RT-PGE system (TOYOBO, Osaka, Japan) and SYBR Green RT-PCR Kit (TOYOBO) with the specific primers listed in Table 1. We selected several isolates to analyze the expression of fim (DC3362, DC3365, DC3220, DC3224, DC3242, ATCC 25922), usp (DC3224, DC3242), iron (DC3362, DC3365, DC3242, ATCC 25922), and pgaABCD (DC3362, DC3365, DC3242, ATCC 25922) genes according to the gene carrying conditions (Table 2). The 16S rRNA gene was used as an internal control to normalize the data. Each sample was measured in triplicate and mean of Ct values were used for analysis. Gene expression levels were calculated using 2−ΔΔCt method [ΔCt (isolates with sub-MIC of CIP)=Ct (genes of isolates with sub-MIC of CIP)−Ct (16S rRNA gene of isolates with sub-MIC of CIP); ΔCt (isolates without sub-MIC of CIP)=Ct (genes of isolates without sub-MIC of CIP)−Ct (16S rRNA gene of isolates without sub-MIC of CIP); −ΔΔCt=ΔCt (isolates without sub-MIC of CIP)−ΔCt (isolates with sub-MIC of CIP)].14
Primers used for expression analysis of virulence genes and biofilm-forming genes in E. coli isolates.
| Function | Genes | Primer sequence (5′–3′) | Reference |
|---|---|---|---|
| Iron acquisition systems | iron | AAGTCAAAGCAGGGGTTGCCCG | 3 |
| GACGCCGACATTAAGACGCAG | |||
| iuc | ATGAGAATCATTATTGACATAATTG | 3 | |
| CTCACGGGTGAAAATATTTT | |||
| Adhesins | fim | GAGAAGAGGTTTGATTTAACTTATTG | 3 |
| AGAGCCGCTGTAGAACTGAGG | |||
| afaI | GCTGGGCAGCAAACTGATAACTCTC | 3 | |
| CATCAAGCTGTTTGTTCGTCCGCCG | |||
| sfa | CTCCGGAGAACTGGGTGCATCTTAC | 3 | |
| CGGAGGAGTAATTACAAACCTGGCA | |||
| iha | CTGGCGGAGGCTCTGAGATCA | 3 | |
| TCCTTAAGCTCCCGCGGCTGA | |||
| Toxins | cnf1 | AAGATGGAGTTTCCTATGCAGGAG | 3 |
| TGGAGTTTCCTATGCAGGAG | |||
| hlyA | AACAAGGATAAGCACTGTTCTGGCT | 3 | |
| ACCATATAAGCGGTCATTCCCGTCA | |||
| set | GTGAACCTGCTGCCGATATC | 3 | |
| ATTTGTGGATAAAAATGACG | |||
| astA | ATGCCATCAACACAGTATAT | 3 | |
| GCGAGTGACGGCTTTGTAGT | |||
| usp | ACATTCACGGCAAGCCTCAG | 3 | |
| AGCGAGTTCCTGGTGAAAGC | |||
| Biofilm formation | pgaA | TCTTGCGGCGTATATTGGTAGGT | This study |
| CGACCCGACAATCACCAGTACG | |||
| pgaB | CGACGAAATGCGGCAATAACAC | This study | |
| GCGGCGGCATATATTGTGGAAC | |||
| pgaC | TCACCATCGGGATCAGCAAAT | This study | |
| GCAGCAGAATACCGGGAAAGA | |||
| pgaD | GGGATCTTGCGGTTCACGTTC | This study | |
| AACGCACCAGGAAATCAGGGAC | |||
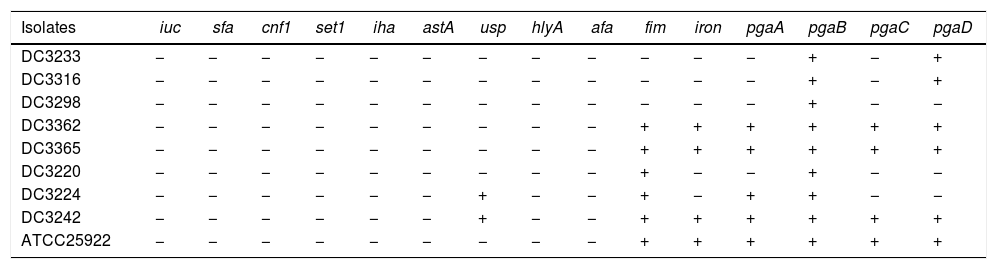
The carrying of virulence genes and biofilm-forming genes of E. coli.
| Isolates | iuc | sfa | cnf1 | set1 | iha | astA | usp | hlyA | afa | fim | iron | pgaA | pgaB | pgaC | pgaD |
|---|---|---|---|---|---|---|---|---|---|---|---|---|---|---|---|
| DC3233 | − | − | − | − | − | − | − | − | − | − | − | − | + | − | + |
| DC3316 | − | − | − | − | − | − | − | − | − | − | − | − | + | − | + |
| DC3298 | − | − | − | − | − | − | − | − | − | − | − | − | + | − | − |
| DC3362 | − | − | − | − | − | − | − | − | − | + | + | + | + | + | + |
| DC3365 | − | − | − | − | − | − | − | − | − | + | + | + | + | + | + |
| DC3220 | − | − | − | − | − | − | − | − | − | + | − | − | + | − | − |
| DC3224 | − | − | − | − | − | − | + | − | − | + | − | + | + | − | − |
| DC3242 | − | − | − | − | − | − | + | − | − | + | + | + | + | + | + |
| ATCC25922 | − | − | − | − | − | − | − | − | − | + | + | + | + | + | + |
“+”: The isolate carry the gene.
“−”: The isolate does not carry the gene.
The results of the OD were compared using the Student's t-test. Results with p-values <0.05 were considered to be statistically significant in our study.
3Results3.1Susceptibility testing and growth curvesThe MICs of CIP for DC3233, DC3298, DC3316, DC3362, DC3365, DC3220, DC3224, DC3242 and ATCC 25922 were 32μg/mL, 128μg/mL, 64μg/mL, 128μg/mL, 128μg/mL, 0.25μg/mL, 1μg/mL, 0.008μg/mL, 0.015μg/mL, respectively. According to the growth curve, 1/4 MIC of CIP had negligible effects on the growth of E. coli ATCC 25922 and so we chose this concentration for further study (Fig. 1).12
3.2Effects of sub-MICs of CIP on biofilm formation on the growth of E. coli ATCC 25922.")
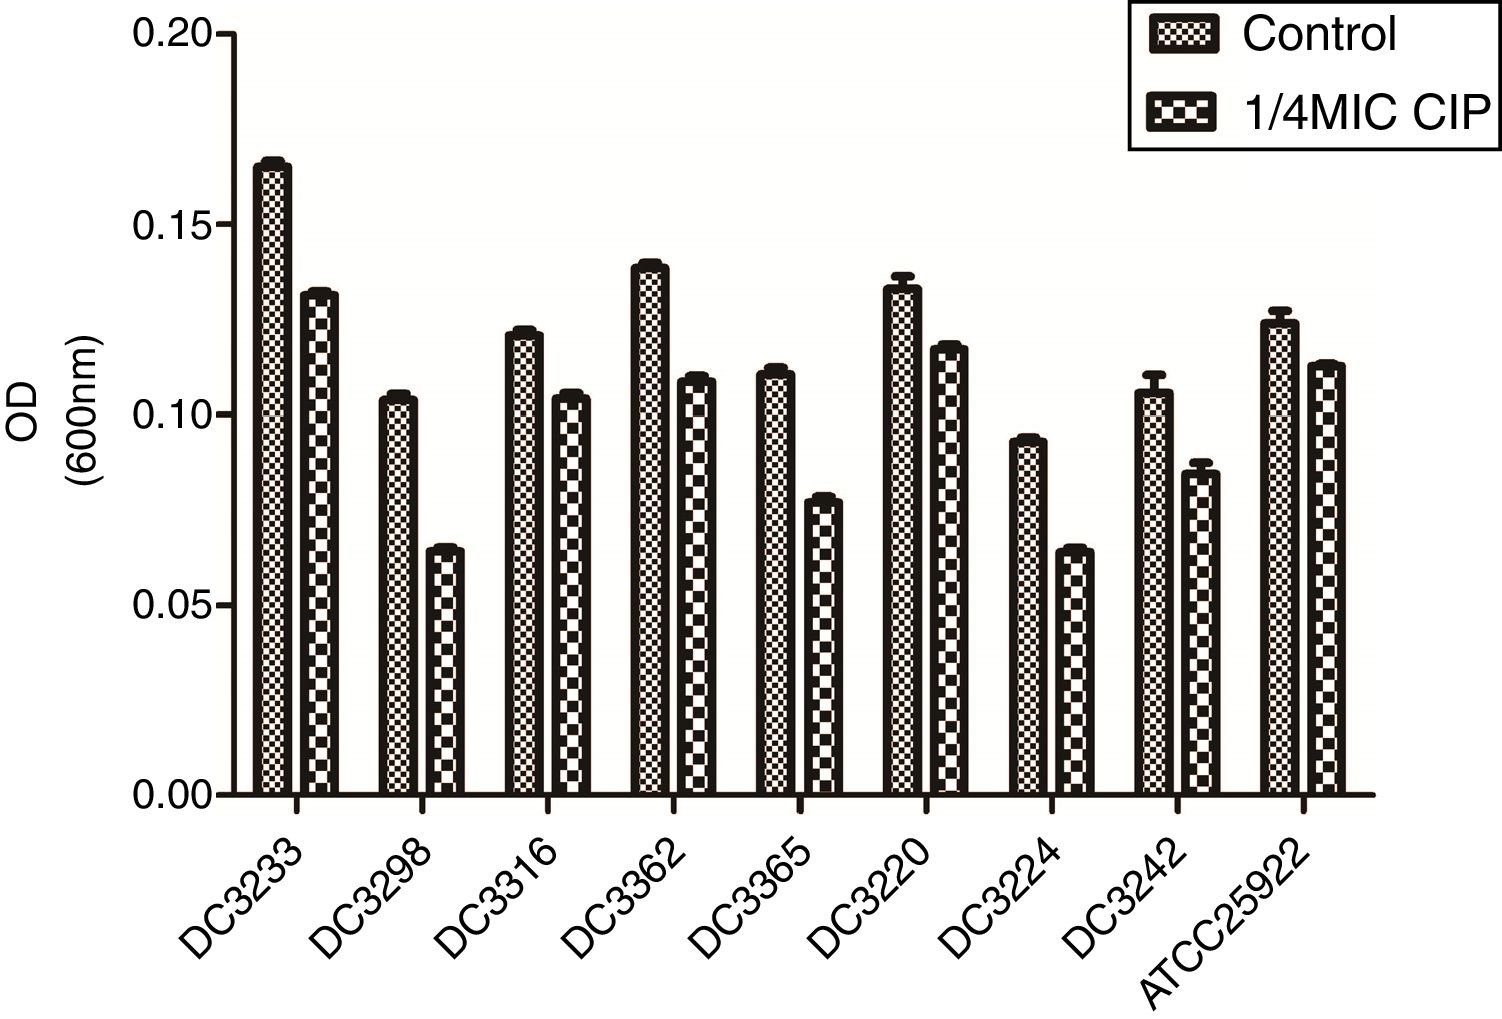
To evaluate the effects of sub-MICs of CIP on biofilm formation, the biofilm-forming capacity of eight E. coli clinical isolates and E. coli ATCC 25922 was assessed. The results demonstrated that sub-MICs of CIP significantly inhibited the formation of E. coli biofilms (P<0.01) (Fig. 2).
 of ciprofloxacin. “Control”, E. coli isolates and ATCC 25922 were cultured without 1/4 minimum inhibitory concentration of ciprofloxacin. “1/4 MIC CIP” E. coli isolates and ATCC 25922 were cultured with 1/4 minimum inhibitory concentration of ciprofloxacin. The biofilm-forming capabilities of E. coli isolates incubated with ciprofloxacin were impaired compared to untreated isolates. P<0.01.")
Biofilm-forming capabilities of Escherichia coli isolates in the presence and absence of sub-minimum inhibitory concentration (MICs) of ciprofloxacin. “Control”, E. coli isolates and ATCC 25922 were cultured without 1/4 minimum inhibitory concentration of ciprofloxacin. “1/4 MIC CIP” E. coli isolates and ATCC 25922 were cultured with 1/4 minimum inhibitory concentration of ciprofloxacin. The biofilm-forming capabilities of E. coli isolates incubated with ciprofloxacin were impaired compared to untreated isolates. P<0.01.
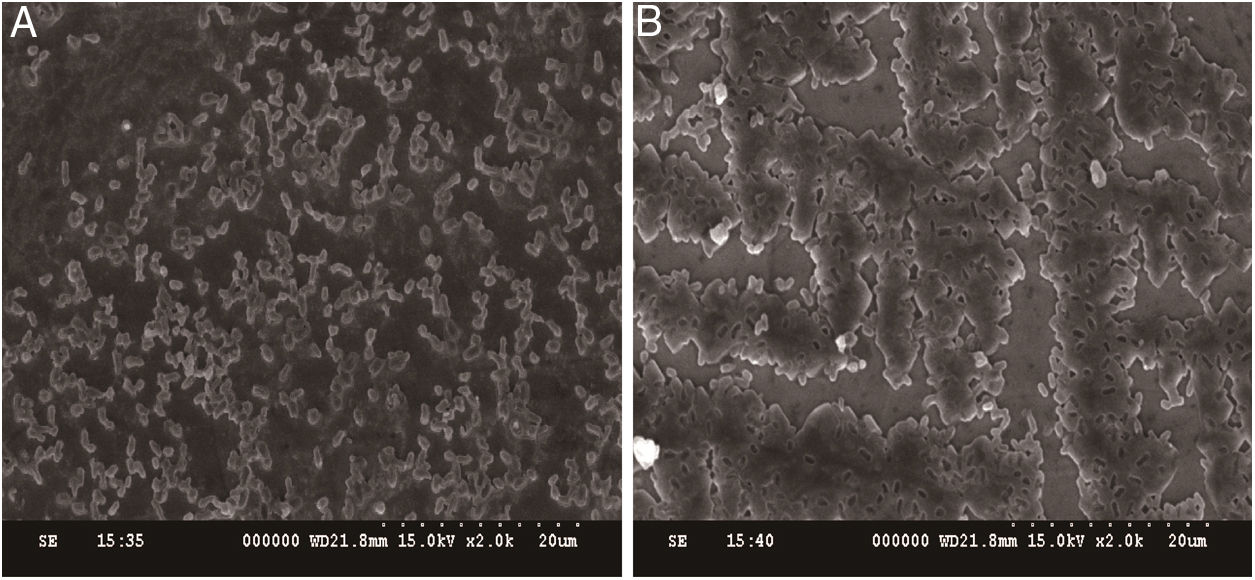
In addition to measuring biofilm formation, we also conducted SEM experiments to determine whether the structure of the biofilms changed in response to CIP treatment. The results revealed that untreated E. coli ATCC 25922 biofilms appeared dense and clustered into a macrocolony. In contrast, E. coli ATCC 25922 biofilms treated with 1/4 MIC of CIP appeared sparse and dispersed (Fig. 3A and B). These results were consistent with the quantitative biofilm experiments, showing that both the biofilm formation ability and the structure of biofilms were affected by 1/4 MIC of CIP.
 of ciprofloxacin on biofilm formation in Escherichia coli ATCC 25922. (A) Biofilms of E. coli ATCC 25922 treated with sub-MIC of ciprofloxacin appears dispersed and sparse. (B) Biofilms of E. coli ATCC 25922 cultured without ciprofloxacin appears dense.")
Effect of sub-minimum inhibitory concentration (MICs) of ciprofloxacin on biofilm formation in Escherichia coli ATCC 25922. (A) Biofilms of E. coli ATCC 25922 treated with sub-MIC of ciprofloxacin appears dispersed and sparse. (B) Biofilms of E. coli ATCC 25922 cultured without ciprofloxacin appears dense.
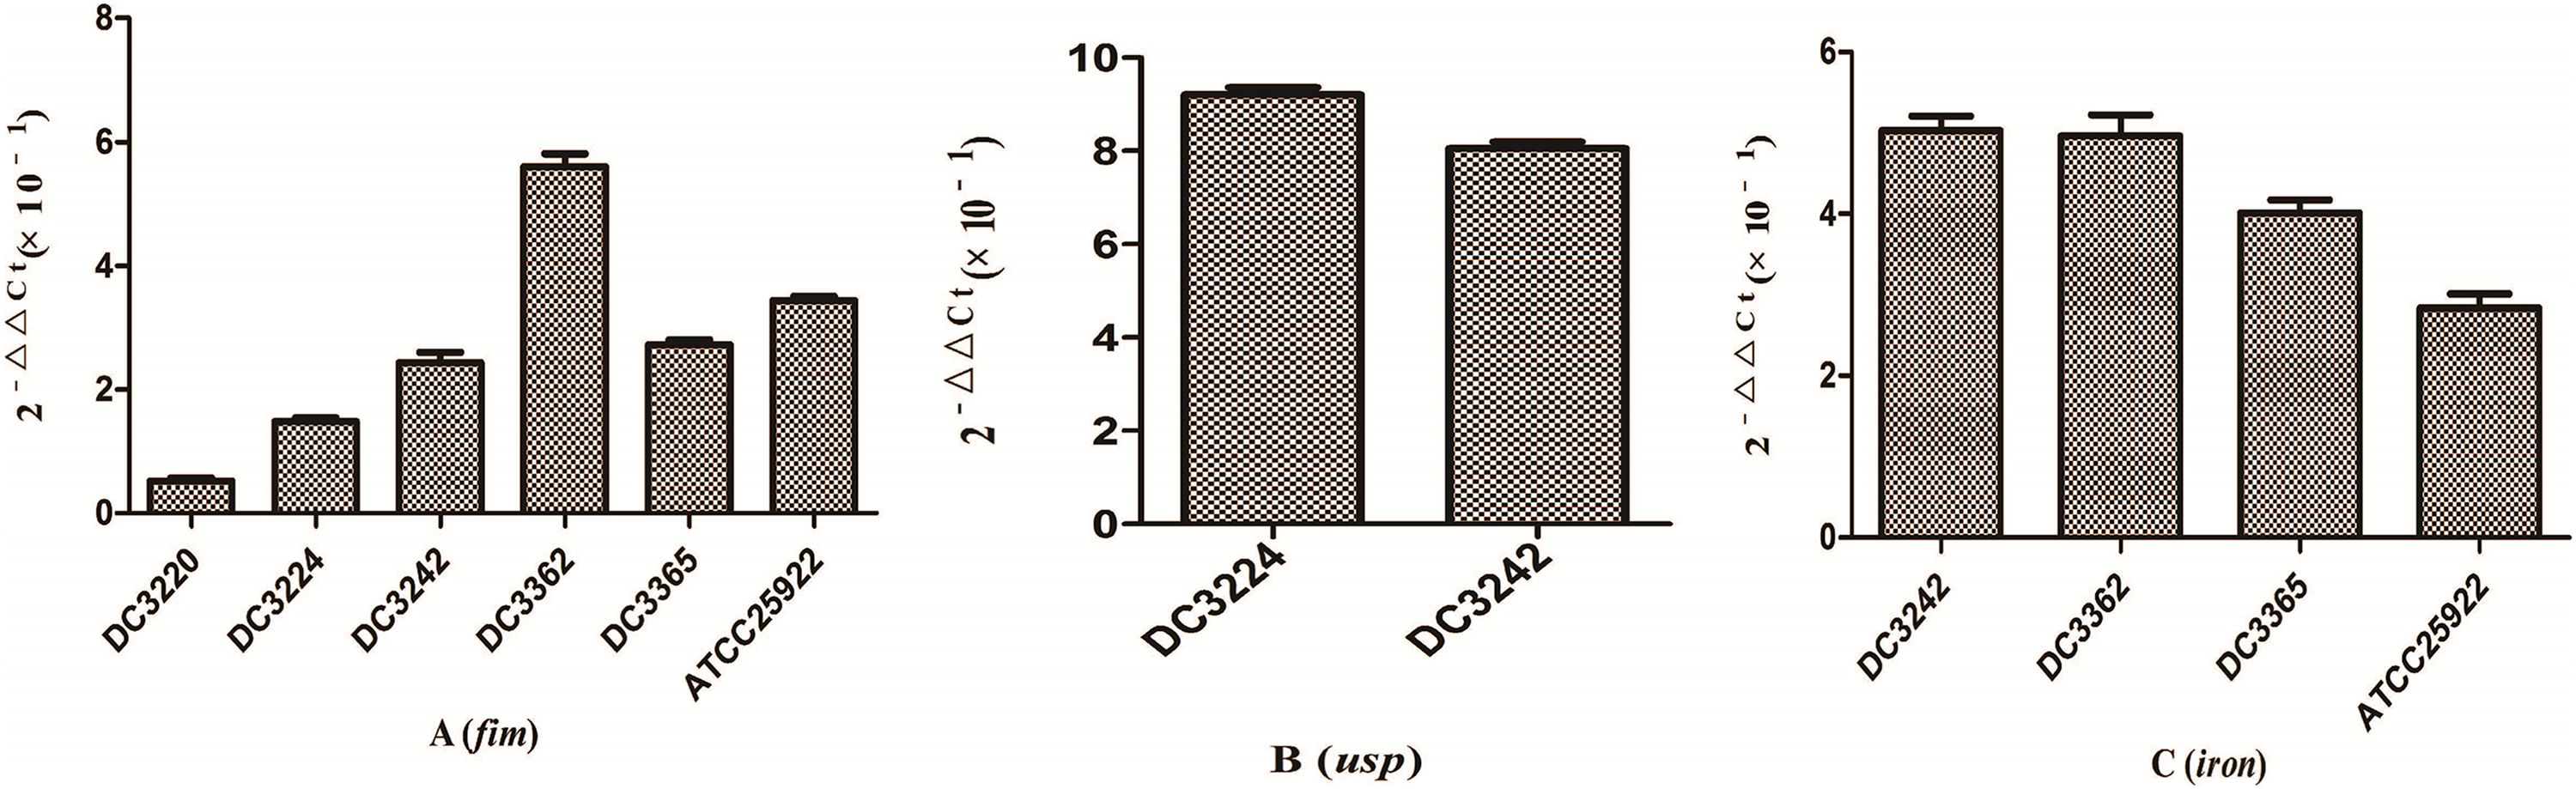
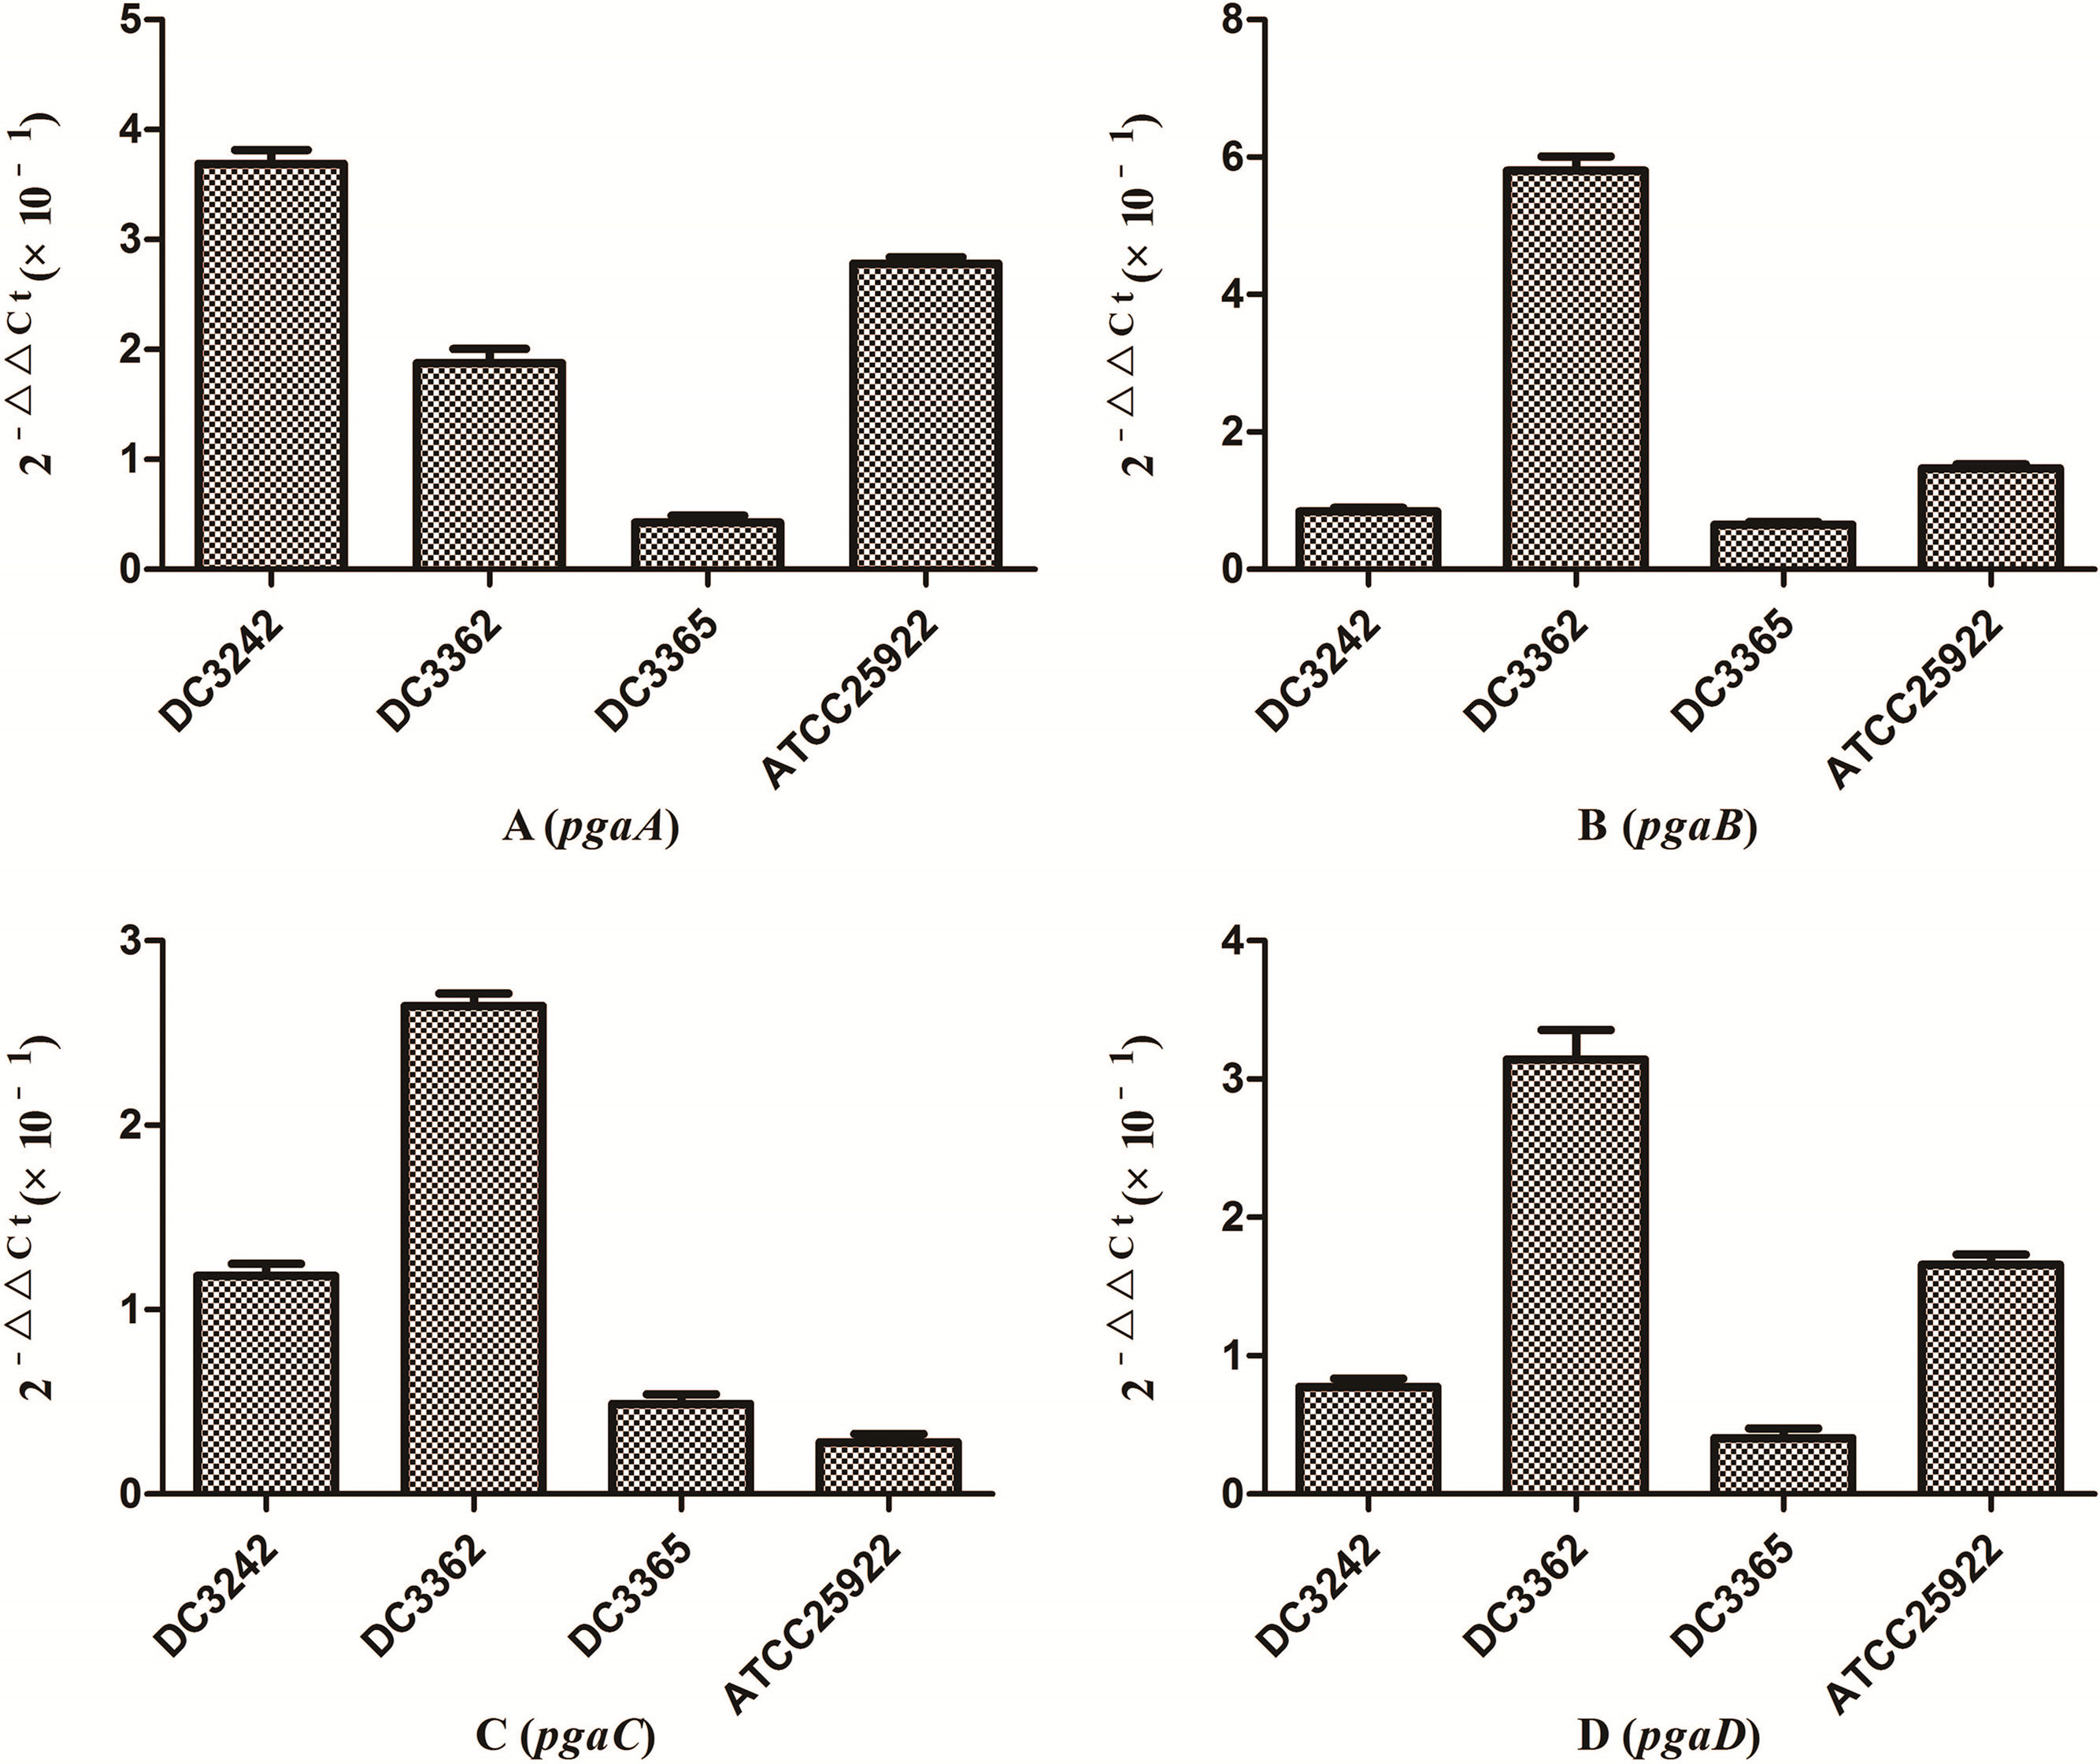
We investigated the expression of virulence and biofilm formation genes in eight E. coli clinical isolates and E. coli ATCC 25922 incubated with sub-MICs of CIP. The carrying status of virulence and biofilm formation genes for each isolate are shown in Table 2. The results showed that the expression levels of virulence and biofilm formation genes were lower in strains treated with sub-MICs of CIP compared to untreated strains (Figs. 4 and 5). This decrease in the expression of biofilm formation genes was consistent with previous results demonstrating that sub-MICs of CIP inhibit biofilm formation. We speculated that the inhibition of biofilm formation can be attributed to the inhibition of gene expression.
 of ciprofloxacin. (A) fim gene. (B) usp gene. (C) iron gene. Sub-MICs of ciprofloxacin inhibited the expression of virulence genes.")
 of ciprofloxacin on expression ratio of E. coli biofilm formation genes. (A) pgaA gene. (B) pgaB gene. (C) pgaC gene. (D) pgaD gene. The expression levels of biofilm formation genes were suppressed by sub-MICs of ciprofloxacin.")
Extensive use of antibiotics for the treatment of infections has led to the development of drug resistance in various pathogens, including E. coli. Gupta et al.12 proposed that the increasing rate of resistance to antibiotics warrants further research into the discovery of therapeutic agents that target pathogen physiology rather than pathogen growth. In addition to having bactericidal effects, some antibiotics could also affect the physiology of microorganisms by altering gene expression at concentrations below the MIC values. It has been shown that the sub-MIC of some antibiotics, including azithromycin and CIP, reduce the pathogenicity of Pseudomonas aeruginosa by inhibiting biofilm formation and virulence.12,16 The present study was designed to determine whether sub-MICs of CIP affect E. coli virulence by inhibiting biofilm formation.
Biofilms are communities of microorganisms that adhere to each other on living or non-living surfaces within a self-produced matrix of extracellular polymeric substances including polysaccharides, extracellular DNA, and proteins.17 Biofilms have been found to be involved in multiple microbial infections and it is estimated that 80% of all infections are caused by biofilm-forming bacteria and fungi.17 In the present study, the results of crystal violet staining experiments showed that the formation of biofilms was inhibited by sub-MICs of CIP. SEM analyses indicated that sub-MICs of CIP interfered with biofilm structure.
It has been reported that the pgaABCD locus of E. coli promotes the synthesis of polysaccharide adhesins, which are required for biofilm formation.4 We found that the expression of pgaABCD genes was suppressed by sub-MICs of CIP. This was similar to the results of previous studies, which found that sub-MICs of CIP and ceftazidime could inhibit the formation of biofilms of P. aeruginosa by inhibiting the quorum-sensing system.12,18 Based on our results, we speculate that sub-MICs of CIP inhibited biofilm formation by inhibiting the expression of pgaABCD genes resulting in decreased extracellular polysaccharide release.
The pathogenicity of E. coli isolates is due in part to their virulence factors.3,19 Iron is an important element for bacterial survival and for promoting a variety of cellular activities in the organism. Bacteria have developed a several strategies for acquiring iron during infection, including the expression of iron acquisition systems that remove iron from the environment and concentrate it in the bacterial cytosol.3 In our study, the expression of the iron gene, which is associated with iron acquisition systems was suppressed by CIP.
The fim gene cluster, which encodes type 1 fimbriae, mediates bacterial adhesion to and invasion of bladder epithelial cells.3,20 We found that six of the nine E. coli isolates tested carrying the fim gene had its expression levels reduced after CIP treatment. It was also previously reported that expression of the usp gene increased E. coli infectivity in a mouse model of pyelonephritis, suggesting that usp may also play a role in the pathogenesis of uropathogenic E. coli.3,21 In the current study, we found that the expression of usp was suppressed by CIP treatment. Based on these results, we speculate that sub-MICs of CIP reduce E. coli virulence. These results are consistent with some reports but are contrary to other researches. A previous study proposed that sub-MICs of amikacin and CIP reduced bacterial virulence by interfering with bacterial cell functions.22 Others have suggested that sub-MICs of CIP enhance Enterococcus faecium pathogenicity.23 Since we observed some differences between individual isolates, we speculate that the effects of sub-MICs of antibacterial drugs on the virulence of isolates vary. The specific mechanisms need to be explored further.
The results of our experiments showed that sub-MICs of CIP reduced the virulence of E. coli isolates. Limitations of this study include the absence of animal experiments to verify the reduction in E. coli virulence and the limited number of isolates. We will continue this research to overcome these limitations and to learn more about the specific mechanisms that affect biofilm formation, virulence gene expression, and bacterial colonization.
In conclusion, we found that biofilm formation and expression of the virulence factors genes pgaABCD, iron, fim and usp were significantly inhibited by sub-MICs of CIP. These results suggest that CIP may be a good treatment option for biofilm-associated bacterial infections. Because antibiotics are often present at sub-MICs in the body, this could provide a theoretical basis for the clinical use of drugs in the treatment of E. coli-related infections. This phenomenon deserves continued attention of clinicians.
5Conflicts of interestThe authors declare no conflicts of interest.
This work was supported by the Zhejiang Provincial Program for the Cultivation of High-Level Innovative Health Talents [no. (2012)241].
