
The Brazilian Public Health Service provides freely αPEG-IFN to treat patients infected with HCV. The primary goal of HCV therapy is the long-term elimination of HCV from the blood to reduce the risk of HCV associated complications and death. Patient viremia affects the treatment duration and response, thus influencing clinical decisions. We developed a high-throughput method to perform the quantification of RNA hepatitis C virus (HCV) virus load in plasma samples to monitor patients under treatment. The method is based on a duplex detection, in a one-step real-time RT-PCR assay and it has been validated according to the rules established by the official Brazilian regulatory agency (ANVISA). This new method was compared to a commercial kit (Cobas/Taqman HCV Test v2.0 - Roche), showing virus load results with significant correlation between them (p = 0,012) using commercial and clinical panels. In addition, 611 samples from patients treated with peguilated alfa-interferon (αPEG-IFN) from different regions of Brazil were analyzed. Our one-step real-time RT-PCR assay demonstrated good performance in viral load measurement and in treatment course monitoring, with acceptable sensitivity and specificity values
Hepatitis C virus (HCV) belongs to the family Flaviviridae, genus Hepacivirus. HCV infection is one of the major causes of chronic liver disease and an important health problem worldwide. According to recent estimates, 71 million people have chronic hepatitis C infection around the world, of whom 399 thousand die each year from HCV-related liver diseases, which include liver cirrhosis and hepatocellular carcinoma (1,2). The hepatitis C virus is a blood borne virus and the most common routes of infection are:(a) unsafe drug injection practices; (b) not adequate sterilization of medical equipment; and (c) transfusion of unscreened blood and/or blood products. (2).
There is great genetic heterogeneity among the different strains of HCV, with at least six classical HCV genotypes identified across the world (3,4,5). Genotype 1-3 is distributed worldwide, while genotypes 4 and 5 are found mainly in Africa and genotype 6 is found primarily in Asia (6). In Brazil, genotypes 1, 2, 3, 4 and 5 are present however, genotype 1 is the most prevalent in different country regions (7). HCV genotype variation is an important factor for management of infected patients once it is associated with different responses to peguilated alfa-interferon (αPEG-IFN) based anti-HCV treatment. Patient viremia is a factor that also affects the treatment duration and response, thus influencing the antiviral dosage decision in clinic studies. It has been shown that patients infected with genotype 1 and 6 had viral loads higher than those infected with genotype 2 or 3 (8,9) and this can impact the sustainable virological response (SVR) to therapy.
The Brazilian Public Health Service provides freely αPEG-IFN to treat patients infected with HCV. The primary goal of HCV therapy is the long-term elimination of HCV from the blood, which prevents hepatic cirrhosis, hepatocellular carcinoma and severe extra-hepatic manifestations. It reduces the risk of HCV associated complications and death (10). The aim of treatment in HCV infection are to eliminate infection and consequently prevent or reverse histological changes, reduce the risk of developing hepatocellular carcinoma (HCC) and transmission of infection to other individuals (11).
A SVR to treatment is defined as undetectable HCV RNA after 12 weeks (SVR12) or 24 weeks (SVR 24) of treatment completion (9,12). Predicting the outcome of patients with HCV infection that have been treated has been a challenging task. In this way, it is important to understand the natural history of the hepatitis C virus infection and the nature of resistance to interferon-α therapy (13). Variation in the HCV genotype is an important factor when treating the infected patients. Studies have shown that patients infected with genotypes 1 or 6 had higher viral loads than those infected with genotype 2 or 3 (8,9,14). Long-term follow-up studies have shown that a SVR in more than 95% of cases may represent a cure from HCV infection (15).
We describe herein the development and validation, according to the rules established by the official Brazilian regulatory agency, of a complete analytical assay for the detection and quantification of HCV RNA (viral load) in human plasma specimens based on reverse transcription (RT) coupled real-time PCR. Additionally, a clinical evaluation was performed, through the virological response, of 611 patients treated with αPEG-IFN.
Materials and methodsSamplesSamples from 611 patients with hepatitis C, attending public hospitals in south, southeast and northeast regions of Brazil were used in this study, during 2013. We did a longitudinal, prospective analysis for virologic success (based on viral load assay) of sustained response to treatment (viral load undetectability) after 12 and 24 weeks of treatment initiation with αPEG-IFN monotherapy. Whole blood specimens were collected when patient first arrived at the hospital seeking treatment and during the weeks 4, 8, 12 and 24 of treatment with αPEG-IFN monotherapy. The specimens were collected in sterile Vacutainer PPT tubes (BD); centrifuged 10 minutes at 2400 x g and stored at −80 °C until isolation of RNA. Plasma samples were used to determine pre-treatment and on-treatment viral loads. The present study was conducted in accordance with the provisions of the declaration of Helsinki and Good Clinical Practice guidelines, approved by Ethical Committee in Research (IRB approval # GPPG 09581).
Commercial International PanelsA standard reference panel was calibrated against the WHO 3rd Hepatitis C Virus (HCV) RNA International Standard (NIBSC 06/100), containing plasma with genotype 1a HCV. The material was calibrated in an international collaborative study involving 33 laboratories, yielding a consensus viral load of 154.88 IU ml-1. Using this calibrated specimen a secondary panel of concentrations of 1.9E + 03 IU ml-1, 9.6E + 02 IU ml-1, 4.8E + 02 IU ml-1, 2.4E + 02 IU ml-1, 1.2E + 02 IU ml-1, 6.0E + 01 IU ml-1and 3.0E + 01 IU ml-1was developed. All dilutions of this panel were made in negative human plasma.
Virus like Particle from Internal control and standard curveThe internal control (IC) is a virus like particle (VLP) that mimics HIV virions. It is biosafe because it does not have the envelope proteins from HIV virus responsible for the interaction with CD4 molecule. Thus, this VLP has no ability to replicate. The IC aims to control all steps of RNA extraction, purification, detection and quantification without cross-react with the detection of HCV RNA possibly present in the plasma.
The standard curve of quantitative calibration was performed with another VLP derived from the HIV genome backbone with an insertion of the 5’ UTR fragment from HCV genome at the env gene of HIV, with this non-infective hybrid HCV 5’UTR - HIV VLP allows biosafe handling as positive control for both viruses (VLP HIV/5’UTR HCV). Both VLPs are are protected by patent PI0600715-5 (16).
RNA extractionA molecular biology workstation (BioRobot MDx, Qiagen) using the QIAamp one-for-all nucleic acid kit (Qiagen) was used to isolate HCV RNA from patient’s samples, according to the manufacturer’s instruction. RNA was extracted from 530 µL plasma and eluted in 65 µL elution buffer. The internal control (IC) was added to each sample before extraction (11.3 µL) in a fixed concentration to reach Real time PCR detection Ct = 33.
For HCV quantification by COBAS/Taqman HCV Test v2.0 (Roche), RNA was isolated with the High Pure System Viral Acid Kit (Roche), according to the manufacturer’s instruction.
Real time RT-PCR amplificationThe real-time RT-PCR reaction set-up was carried out a using an automated workstation (Janus, PerkinElmer). HCV detection was done by a duplex, one-step, real time RT-PCR, in a 50μL total volume reaction, with 1x PCR mix (Bio-Manguinhos), 0.2 μM of primers and 0.4 μM of probes. Primers were originally designed to KIT NAT HIV/HCV/HBV (Bio-Manguinhos - ANVISA registration number 80142170025) and target the consensus 5’ UTR region of HCV genome from Brazilian and worldwide isolates (obtained from Los Alamos HCV sequence Databank). HCV Probe carries a 6-FAM fluorescence dye at its 5’ end and a NFQ dark quencher (Thermo Fisher Scientific) at its 3’ end, together with a MGB DNA clamp (Thermo Fisher Scientific).
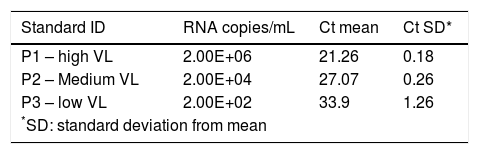
The standard curve is composed by 3 standards with different viral loads, standard P1 with high viral load (2E + 06 IU ml-1), standard P2 with medium viral load (2E + 04 IU ml-1), and standard P3 with a low viral load (2E + 02 IU ml-1).
The amplification was performed on the Life technologies 7500 real-Time PCR system (Thermo Fisher Scientific). The PCR thermal profile consisted in an initial incubation for 30 min at 51 °C, a second step of 10 min at 95 °C, followed by 50 cycles of 30 s at 95 °C and 1 min at 60 °C. Fluorescence signal detection was performed at annealing/extension step of each cycle. Threshold value were defined based on the limit of detection assay with the WHO 3rd Hepatitis C Virus (HCV) RNA International Standard (NIBSC). The threshold value for the IC was set 0.3 and it was set at 0.2 to clinical samples and standard curves.
Validation of the Real-time RT-PCR assayValidation of duplex, one-step, real-time RT-PCR assay were performed in accordance to ANVISA (Brazilian Health Regulatory Agency) resolution RDC no 27/ 2012(http://bvsms.saude.gov.br/bvs/saudelegis/anvisa/2012/rdc0027_17_05_2012.html) and 166/2017 (old 899/2003) (https://www20.anvisa.gov.br/coifa/pdf/rdc166.pdf) that regulates the validation of diagnostic tests in medicine.
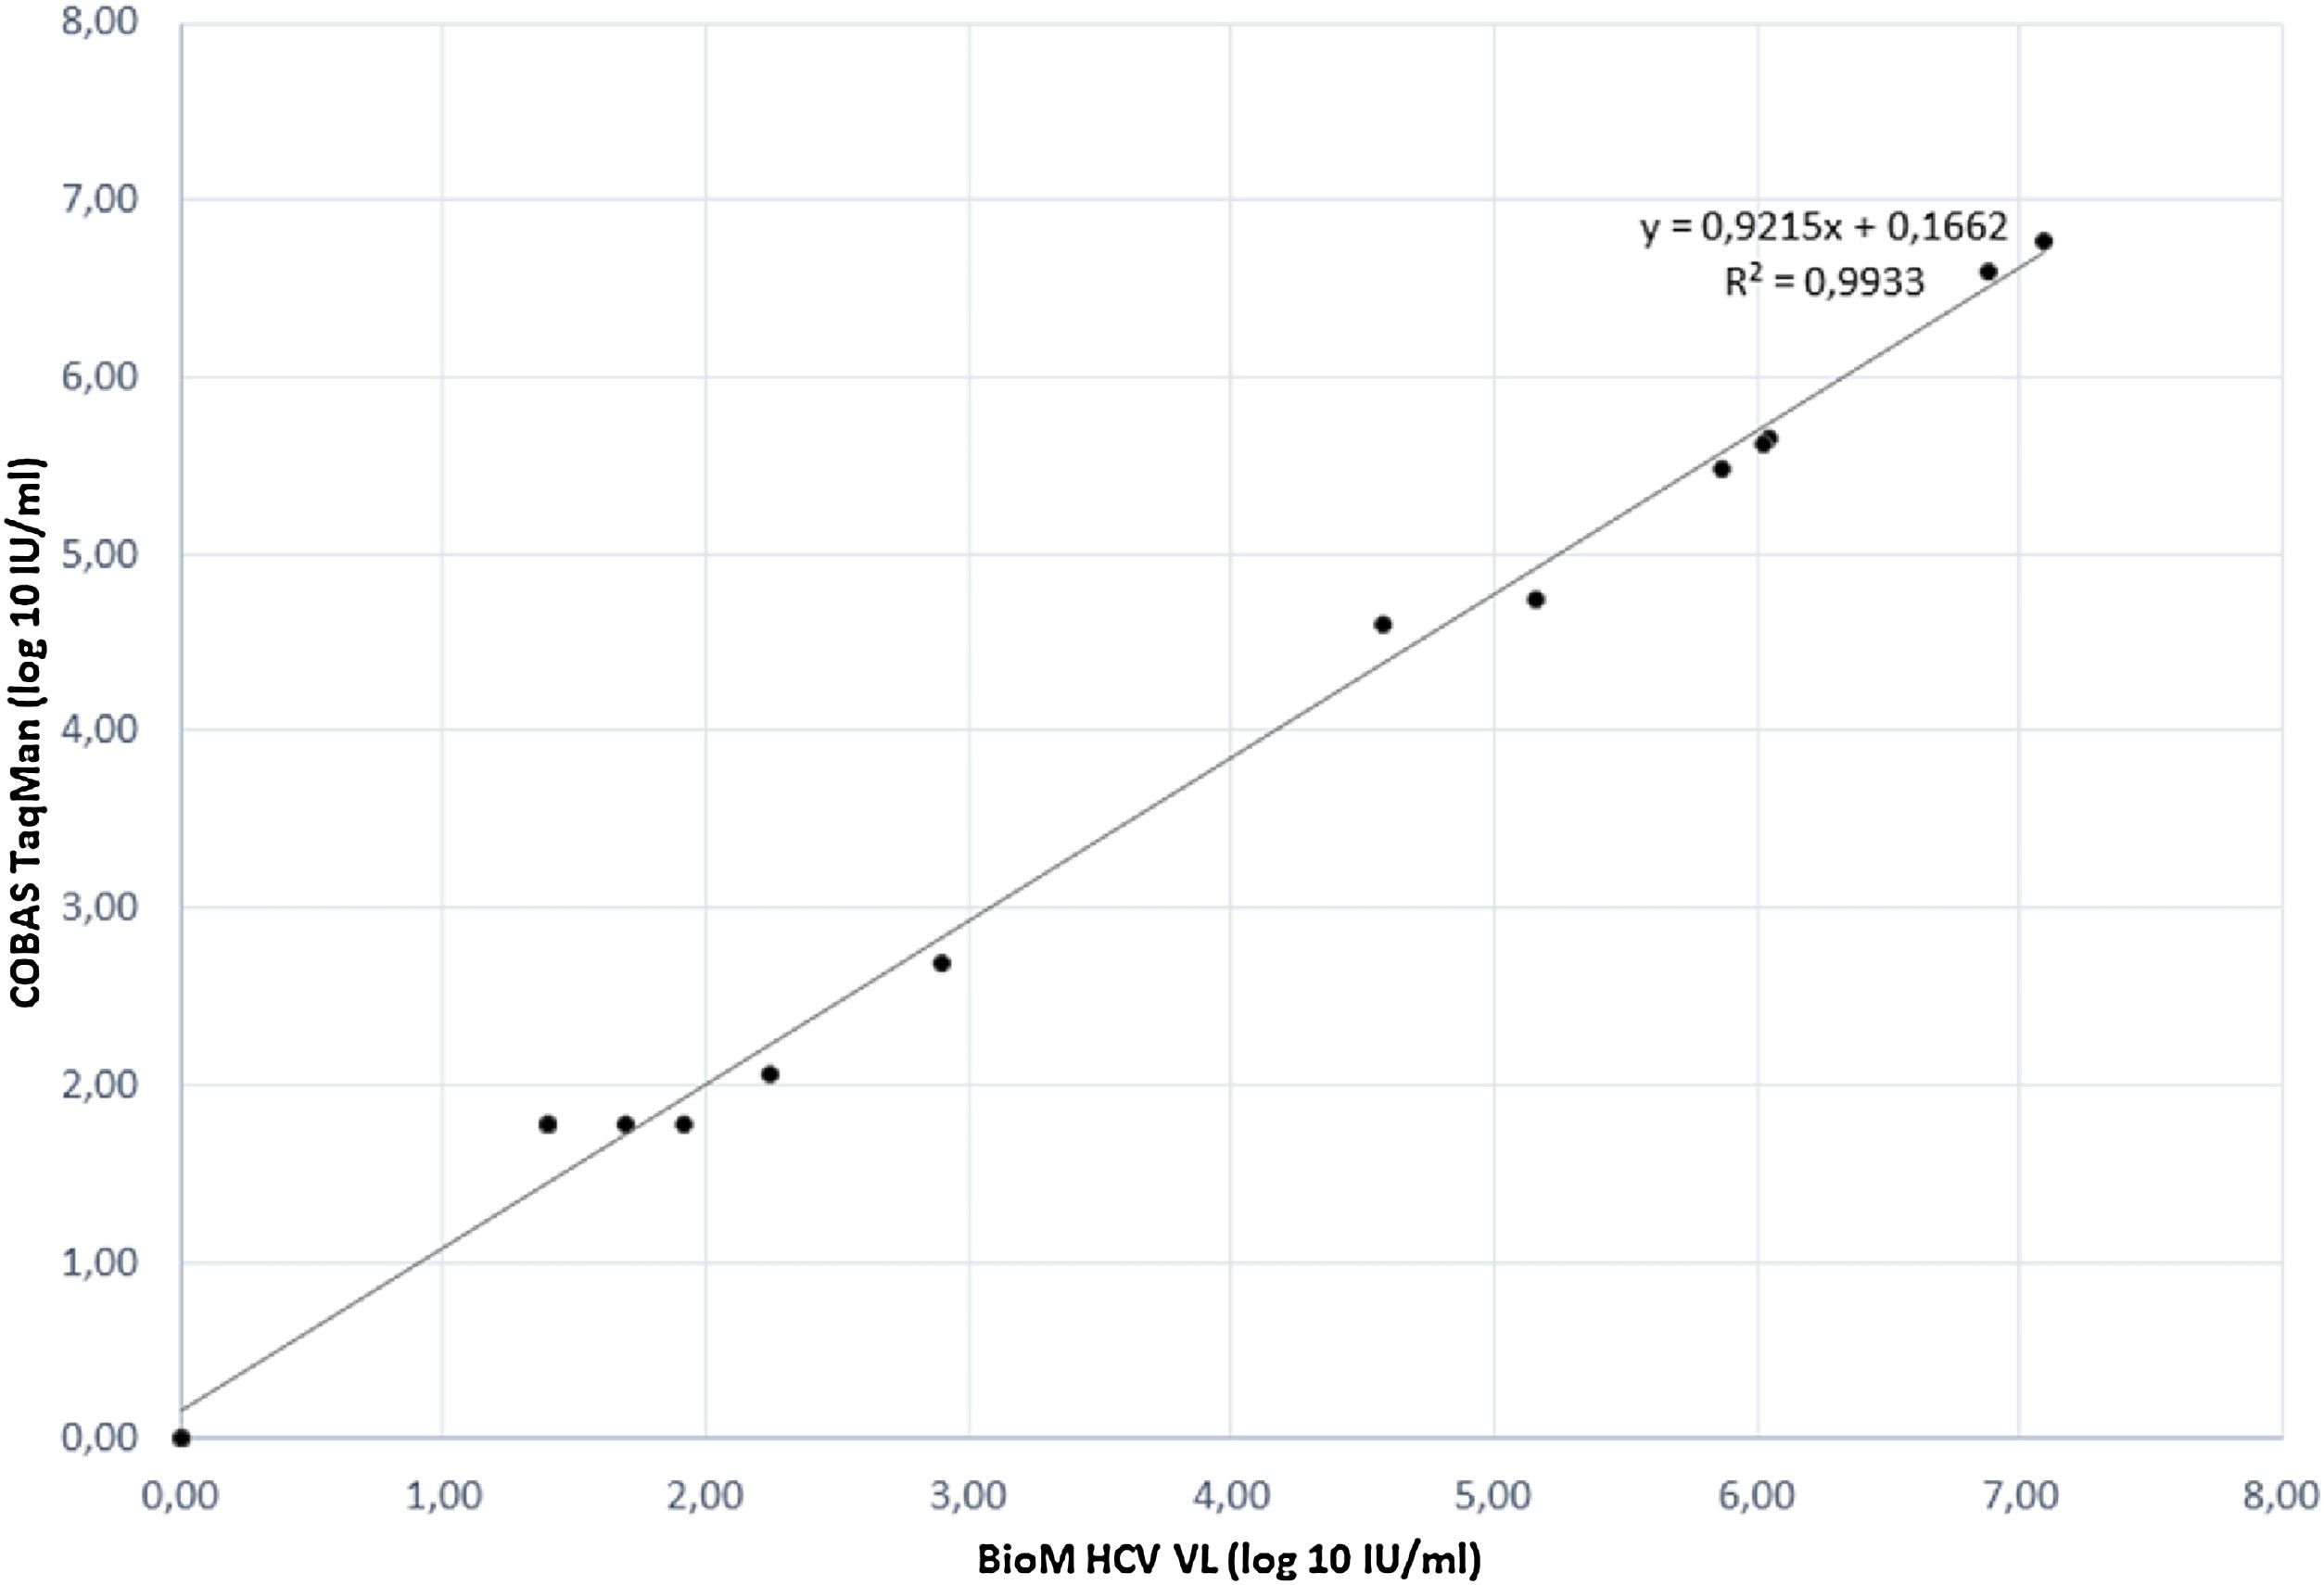
Limit of detection (LOD) or sensitivity of the assay was determined by using the standard reference panel with the viral loads pre-defined (1.9E + 03 IU ml-1, 9.6E + 02 IU ml-1, 4.8E + 02 IU ml-1, 2.4E + 02 IU ml-1, 1.2E + 02 IU ml-1, 6.0E + 01 IU ml-1and 3.0E + 01 IU ml-1) using commercial kit COBAS/Taqman HCV Test v2.0. Each dilution was tested in batches of eight replicates. HCV virus concentrations were log10-transformed for analysis. We examined the linear range by comparing plotted data to a line of equality. Calculated correlation coefficient and linear regression analyses were performed on scatter plots of log-transformed HCV RNA levels using Microsoft Excel (Microsoft Corp.).
Precision of the assay was assessed by testing six different concentrations of HCV RNA (5E + 06 IU ml-1; 1E + IU ml-1; 3E + 03 IU ml-1; 1.5E + 02 IU ml-1; 6E + 01 IU ml-1and 3E + 01 IU ml-1), in batches of eight replicates (intra-assay variability), in three different days (inter-assay variability), followed by statistical calculation of standard deviations (SD) of the mean and confidence intervals of 95%.
A total of 17 clinical samples, positive to HCV RNA, previously characterized by the commercial kit COBAS/Taqman HCV Test v2.0, were submitted to the accuracy assay. The quantification performance of our assay was determined comparing the one-step RT-PCR results with the results obtained by the commercial kit COBAS/Taqman HCV Test v2.0. All operations steps were carried out according to instructions provided by the manufacturer. The test-T Student (with p = 0.05) was used to assess the level of agreement between the two HCV RNA quantification methods, as well as the calculation of the Pearson’s Correlation Regression R2 and R values.
The calibration verification was performed, at least, three times. Calibration assay tested: (i) one true positive HCV RNA sample with 8 different viral loads ranging from 4.53E + 06 IU ml-1 to 6E + 01 IU ml-1; (ii) 8 samples true negative; (iii) 8 replicates of an HCV RNA positive sample with viral load adjusted to 104 IU ml-1; (iv) negative control in duplicates, and (v) three points of the standard curve in duplicates. The IC results were evaluated in all negative samples. The criteria to accept the standard curve to P1 - high VL (2E + 06 IU ml-1) was Cycle Threshold (Ct) value of 21 + 0.6, to P2 - medium VL (2E + 04 IU ml-1) was Ct value of 27 + 0.6 and to P3 - low VL (2E + 02 IU ml-1) was Ct value of 33 + 0.6.
Evaluation of the robustness of our duplex, one-step, real-time RT-PCR assay in the presence of interfering substances was done with the commercial kit OptiChallenge Inhibition Panel (Acrometrix). Negative human plasma, as well as plasma samples spiked with HCV were tested in the presence of EDTA plasma, haemolysed plasma, heparin plasma, triglycerides and bilirubin. Each interfering substance were tested individually.
The HCV genotype panel (HCV RNA Genotype AccuTrak Qualification Panel, Seracare) was also used for the evaluation of the HCV Real time PCR assay. This panel is composed nine samples of genotypes 1-6 (1a, 1b, 2a/c, 2b, 3a, 4a, 5a, 6 and NTC) of HCV with titers ranging from 1,62E + 04 to 1,85E + 05 IU/ml (as determined by Roche AmpliPrep/COBAS TaqMan HCV v2.0 kit).
GenotypingThe Linear Array HCV Genotyping Test (Roche) was used to determine the genotype (1–6) of each HCV sample from patients, according to the manufacturer’s instruction.
ResultsDevelopment of a duplex One-step real-time RT-PCR for HCV and internal control detection
Our one-step real-time RT-PCR assay, named BioM HCV VL test, was designed to perform 88 tests in a 96-well plate. The assay contains a negative control and the VLP standard curve, composed of standard 1 (P1), standard 2 (P2) and standard 3 (P3) samples in duplicates (Table 1). Each standard is made with adjusted concentration of the hybrid VLP HIV/5’UTR HCV corresponding to 2E + 06, 2E + 04 and 2E + 02, respectively. The IC is added to all samples tested and to the negative control. IC guarantees the quality control of all process, from RNA extraction until target amplification and quantification. The overall procedure is completed in 6 hours in an automated system avoiding contamination.
Ct values obtained for kit standards, P1 – high viral load, P2 – medium viral load and P3 low viral load, in duplicates from three assay’s run (6 replicates/ each).
| Standard ID | RNA copies/mL | Ct mean | Ct SD* |
|---|---|---|---|
| P1 – high VL | 2.00E+06 | 21.26 | 0.18 |
| P2 – Medium VL | 2.00E+04 | 27.07 | 0.26 |
| P3 – low VL | 2.00E+02 | 33.9 | 1.26 |
| *SD: standard deviation from mean | |||
No false positive was detected when testing negative plasma samples occasionally contained interfering substances, such as EDTA, hemolysis, heparin, triglycerides or bilirubin (table S1). However, heparin inhibited the target and the internal control amplification.
Quantification by One-step real-time RT-PCR assayThe LOD of our One-step real-time RT-PCR assay for detection was 77 IU ml-1 (136.12 IU ml-1> CI95 > 57.62 IU ml-1). The lower limit of quantification was the lowest concentration in the linear range that met the criteria for variability and was set to 60 IU ml-1. The coefficient of variation (CV) of the calibration curve (table S2) was found to be between 0.22% and 9.29%, according to HCV RNA concentration. The standard curve P1, P2 and P3 fit the criteria of acceptance in all assays. Precision of the assay (table S3) was found to be between 0.51% to 9.88% intra-assay and CV 0.3% to 13.52% inter-assay, depending on the viral load measured.
The correlation between HCV RNA quantification with our BioM HCV VL test and COBAS/Taqman HCV Test v2.0 was evaluated on 17 samples, previously quantified with COBAS/Taqman HCV Test v2.0. The correlation plot of results is presented in Fig. 1. The regression curve showed a significant R2 value of 0.9933 and the observed relationship showed that results obtained from both tests are equivalent in different virus load range (p = 0.012).
HCV genotype detection
Member of HCV genotypes 1, 2, 3, 4, 5 and 6, from the HCV RNA genotype performance panel (HCV RNA Genotype AccuTrak Qualification Panel 2400-0182, Seracare), were successfully detected and quantified by BioM HCV VL Test (table S4), with CT values ranging from 25 to 34, which falls in the range of detection of our kit.
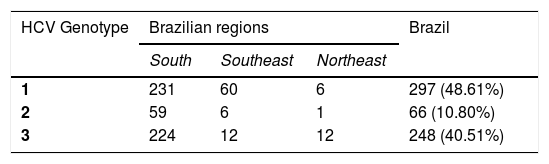
Monitoring patientsHCV Genotype assessment for clinical samplesIn order to evaluate the impact of HCV genotyping on the clinical performance of BioM HCV VL, 611 HCV RNA positive samples from patients under treatment (see item 2.1 in Material and Methods for more details) were subjected to genotype determination. The analysis revealed the presence of genotypes 1, 2 and 3. Genotype 1 was detected in 297 (48.61%) patients, genotype 2 in 66 (10.8%) patients and genotype 3 in 248 (40.51%) patients. Cases with mixed genotype infection were not found. Table 2 shows the distribution of HCV genotype in each region of Brazil.
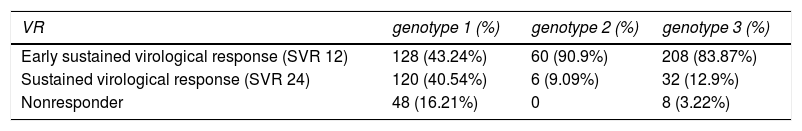
Clinical evaluation through Virological response to treatment analysisIn order to evaluate the virological response on 611 patients under treatment, the viral load of HCV was performed on weeks 4, 8, 12 and 24 of treatment, to calculate the SVR. Table 3 shows the SVR to treatment, for HCV genotypes 1, 2 and 3, after 12 and 24 weeks. Patients infected with HCV genotype 1 presented 43.24% of early virological response (SVR 12), 40.54% of sustained virological response (SVR 24) and 16.21% were non-responders. Patients infected with HCV genotype 2 presented 90.9% of early virological response (SVR 12), 9.09% of sustained virological response (SVR 24) and none nonresponder. In addition, those infected with HCV genotype 3 presented 83.87% of early virological response (SVR 12), 12.9% of sustained virological response (SVR 24) and 3.22% of nonresponder. However, genotype 1 had more nonresponder patients than genotypes 2 and 3 (P < 0.05).
Virological response for different HCV genotypes with αPEG-IFN
| VR | genotype 1 (%) | genotype 2 (%) | genotype 3 (%) |
|---|---|---|---|
| Early sustained virological response (SVR 12) | 128 (43.24%) | 60 (90.9%) | 208 (83.87%) |
| Sustained virological response (SVR 24) | 120 (40.54%) | 6 (9.09%) | 32 (12.9%) |
| Nonresponder | 48 (16.21%) | 0 | 8 (3.22%) |
It was verified that people with genotype 3 had a better early sustained virological response (SVR 12), while those of genotype 1 had a better Sustained virological response (SVR 24).
Regarding genotype 2, we observed that 90.9% presented an early sustained virological response (SVR 12), but since the number of patients with this genotype was very small, we decided not to compare them with the others.
DiscussionThe detection of Hepatitis C virus and its quantification in human plasma are required steps to be taken before patients can be treated and monitored. Using an approach that carries good analytical performance, has high-throughput capacity while it keeps the cost low is no doubt the preferred option. Here, we successfully developed and validated a one-step, duplex, real-time RT-PCR assay for detection and quantification of RNA HCV, in a single tube, with an internal amplification control. It takes about 6 hours to reach the complete HCV RNA quantification for 88 different samples fitted in a 96-well plate with standard curve and negative control. The results obtained by our assay were linear and reproducible. The robustness of the test was demonstrated by the reproducibility study inter-lot and also intra-lot. Heparin was the only interfering substance observed to inhibit the target amplification. It is well know that heparin has been shown to inhibit DNA polymerase activity in PCR and real-time PCR (17,18).
The relationship observed from HCV RNA quantification of our BioM HCV VL and COBAS/Taqman HCV Test v.2.0, showed that both tests are equivalent and the correlation between the methods is lower than 0.4 log IU ml-1 that is the average value of mean differences between commercially available assays for HCV RNA quantification.
The lower limit of quantification of our assay are in accordance with the test specification and with the limits preconized by Brazilian Ministry of Health for HCV RNA quantification for monitoring patients under treatment. However, if we compare the 95% LOD from BioM HCV VL assay with two other commercial assays, such as COBAS AmpliPrep/COBAS TaqMan HCV Test and The Abbott RealTime HCV assay our results are less sensitive.
The present study results showed that HCV genotype 1 was the most common, followed by genotype 3, and type 2. In our study, HCV genotypes 4, 5 and 6 were not detected. Previous data about HCV genotypes in Brazil found types 1, 2, 3, 4 and 5. In all regions genotype 1 was the most frequent, whereas type 4 and 5 are rare (7,19,20,21). The similarities between the pattern of HCV genotypes distribution in Brazil and that found in many European countries have been pointed out. In both cases there are prevalence of types 1 and 3, and the epidemiological behavior observed with the same characteristics of an exponential spread that has taken place in recent years, most likely through blood transfusion (7). The genotype distribution in HCV positive samples has been studied in some European countries, Japan and in the United States. In all cases genotype 1 is the most frequent genotype found (21).
The natural history of HCV genotypes 1, 2 and 3 seems to be similar with patients having a high risk of developing liver cirrhosis and hepatocellular carcinoma. Besides that, genotype 3 is found to be associated with an increase in hepatic steatosis (22). Reports on the relationship between the histological degree of inflammation, the biochemical markers of inflammation alanine transaminase (ALT), and levels of HCV-RNA in the serums are still controversial (8,23). In the present study, viral load quantification was compared between the three genotype groups. After 12 weeks of treatment, the average level of the viral load in patients infected by genotype 2 was significantly higher if compared to that of patients infected with genotypes 1 and 3. However, after 24 weeks, no patient infected with genotype 2 had detectable viral load (data not shown). In fact. HCV genotype 1 infection is described as the most difficult genotype to treat with αPEG-IFN-based antiviral therapies, with low SVR rates, conversely, genotypes 2 and 3 HCV infected patients, have superior SVR rates (24). In this way, we observed that patients infected with genotype 1 had a higher index of nonresponders (16.21%), in relation to genotype 3 (3.22%), and patients infected with genotype 3 presented better early virological response performance (83.87%) (Table 3).
BioM HCV VL test demonstrated good performance in viral load measurement and in treatment course monitoring, with similar sensitivity and specificity values as compared with another commercial method. Once our assay receives its registration, it will likely be introduced into laboratories of public health in Brazil and will be used to evaluate de kinetics of viral load from patients on treatment to achieve better response to treatment.
In conclusion, our BioM HCV VL test proved to be suitable for monitoring patients with chronic HCV infection submitted to antiviral treatment.
Financial support: Fundação Oswaldo Cruz - RJ
Many thanks to Clinical Advice of Bio-Manguinhos (ASCLIN) and FIOCRUZ.
The authors have declare no conflict of interests.
