This study aims to assess the nutritional status of selenium, copper and zinc; and also the erythrocyte superoxide dismutase activity of HIV-infected children compared to a control group.
MethodsA cross-sectional study was carried out with prepubertal HIV-infected children (n=51) and their healthy siblings (n=32). All biochemical measurements including plasma selenium, serum copper levels, serum and erythrocyte zinc levels and erythrocyte superoxide dismutase activity were evaluated according to dietary, clinical and biochemical parameters.
ResultsCompared to the control group, the HIV-infected children had lower z-score values for height-for-age (p=0.0006), higher prevalence of stunting (11.8%) (p=0.047), lower selenium levels (p=0.0006) and higher copper levels (p=0.019). No difference was found concerning superoxide dismutase activity (p>0.05). The HIV-infected group presented a higher proportion (45.1%) of children with zinc intakes below the estimated average requirement (p=0.014); however, no association with zinc biochemical parameters was found.
ConclusionHIV-infected children have an inadequate selenium and copper nutritional status, which could influence the progression to AIDS. An adequate micronutrient status could improve the clinical conditions in these patients and minimize free radical production and cellular oxidative stress.
Oxidative stress, which is caused by an increased production of free radicals and/or an inadequate antioxidant protection mechanism, can be worsened by HIV infection, thereby compromising the immune system.1,2
Antioxidants protect cells and tissues against inflammatory and infectious processes and inhibit lipid peroxidation, acting as anti-atherogenic agents.3 Selenium and copper may influence the progression from HIV to AIDS.4,5 Zinc and copper are components of superoxide dismutase (CuZnSOD), an important antioxidant enzyme; therefore, deficiencies in these minerals may affect this enzyme activity.6 Inadequate intake of antioxidants, such as vitamins and minerals, can lead to impaired immune system and increase in lipid peroxidation, predisposing the individual to infections and aggravating the malnutrition problem.3
In addition to antioxidant nutrients, antioxidant enzymes (e.g., superoxide dismutase, catalase, and glutathione peroxidase) play crucial roles in eliminating free radicals and minimizing the effects of cellular oxidative stress.7
HIV infection itself and its treatment can determine metabolic changes that may increase the mortality risk for HIV-infected children. Nutritional status and biochemical parameters should be evaluated in HIV-infected individuals with low intakes of antioxidant nutrients to minimize adverse health effects.
The objectives of this study were to assess the trace elements antioxidant nutritional status and to determine the erythrocyte superoxide dismutase (SOD) activity in prepubertal HIV-infected individuals compared to the control group.
Materials/subjects and methodsSubjectsA cross-sectional study, which included 83 prepubertal children from both sex, followed up at the Care Center of the Division of Pediatric Infectious Diseases, Department of Pediatrics (CEADIPe), Universidade Federal de São Paulo – UNIFESP/EPM, São Paulo, Brazil. Data were collected from October 2009 to October 2011. This study was approved by the Ethics Committee of Universidade Federal de São Paulo – UNIFESP/EPM and written informed consent was obtained from all of the subjects.
Subjects were distributed into two groups:
- I.
The HIV-infected group consisted of 51 children to whom HIV was transmitted vertically.
- II.
The control group consisted of 32 healthy siblings who were born before the diagnosis of HIV infection in the mother. Mothers were not infected yet with HIV by the time of their pregnancy and/or delivery and it was confirmed by laboratory tests.
Only children who had a Tanner stage 1 pubertal development8 were enrolled in the study. Children with other chronic diseases that could interfere with micronutrient nutritional status or who were receiving vitamin or mineral supplement and also those that were hospitalized or presented severe clinical complications in the year before entering the study were not included.
Clinical and immunological assessmentHIV infection was classified according to the clinical and immunological parameters described by the CDC guidelines (1994).9 Plasma HIV-1 RNA (viral load) was measured by polymerase chain reaction using the Amplicor HIV-1 Monitor (Amplicor Roche Diagnostics), which has a detection limit of 400copies/mL; values were expressed as log10. The CD4+ cell count was determined by flow cytometry and was expressed as percentage (%).9
Anthropometry assessment and dietary intakeWeight (kg) and height (cm) measurements were used to calculate height-for-age (H/A) z-score and body mass index (BMI) z-score, according to WHO Child Growth Standards (2007).10
Energy and macro and micronutrient intake were obtained from the average of four 24-h dietary recalls.11 Data were analyzed using DietWin® software – Porto Alegre, Rio Grande do Sul, Brazil. Estimated energy requirement (EER) equations were used to assess the daily dietary energy requirements. For the macronutrients, we used the acceptable macronutrient distribution range (AMDRs) and the intake was expressed as a percentage of the total energy value (TE).12 The estimated average requirement (EAR) was used for the micronutrients evaluation, values below the cut-off points indicated inadequate nutrient intake.13
Laboratory analysesBiochemical parameters were measured in the absence of infectious processes. Following a 12-h fast, 10mL of blood was collected by venipuncture.
Plasma selenium levels were determined by hydride generation atomic absorption spectrometry (HITACHI brand, model Z-5000) coupled to a quartz cell (HGQTAAS).14 Values were considered low or high when they were below the 2.5 percentile or above the 9.7 percentile, respectively, for age and gender.15 Serum copper measurement were analyzed by atomic absorption spectrophotometry (PERKIN ELMER brand, model 5.100).16 The reference values used were 70–140μg/dL for males and 80–155μg/dL for females.17 Serum and erythrocyte zinc concentrations were analyzed by atomic absorption spectrophotometry (PERKIN ELMER brand, model 5.100).16 The reference values are 40–44μg Zn/g Hb for erythrocyte zinc,18 65–120μg/dL for serum zinc in males, and 60–120μg/dL for serum zinc in females.17 SOD activity in erythrocytes was measured by spectrophotometry and adequate values range from 4.7 to 5.7U/mg of hemoglobin (Hb).19
The Advia Chemistry System 1650 (Bayer®) analyzer and a turbidimetric assay were used to evaluate the level of C-reactive protein (CRP) in the subjects.
Statistical analysesData were analyzed using Epi info 6.04 (Centers for Diseases Control and Prevention, Atlanta, GA, USA) and STATA 10.0 (Stata Corporation, College Station, TX, USA) statistical software.
Differences in the anthropometric characteristics, dietary intake and biochemical parameters among the children were assessed using Student's t-test (for normal distributions) or a Mann–Whitney U-test (for non-normal distributions). Chi-square test and Fisher's exact test were applied to assess the association between the categorical variables according to pre-established cut-off points. Pearson's and Spearman's tests were used to study the correlations between the dietary intake and the biochemical parameters. The statistical significance level was set at p-value <0.05.
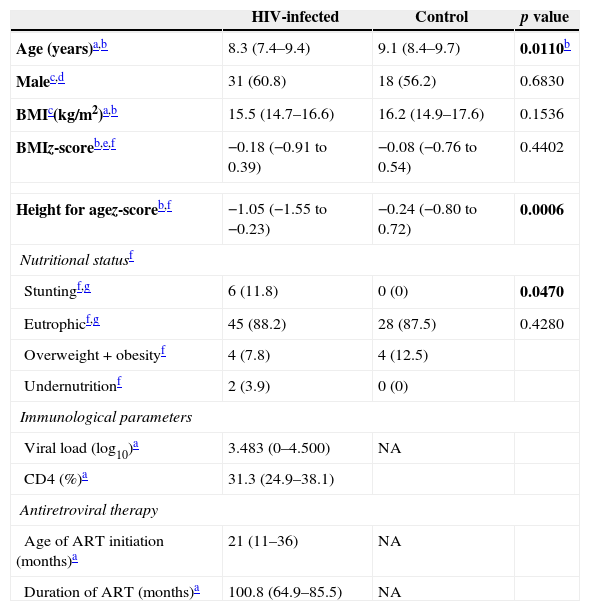
ResultsThere were 83 prepubertal children who participated in the study, 51 were HIV-infected children and 32 were HIV-uninfected children. Table 1 shows the anthropometric characteristics and the nutritional status of both groups and also the virological and immunological parameters of HIV-infected children. The groups were comparable in terms of gender, BMI and proportion of individuals with normal weight. The median age of the HIV-infected group was lower than that of the control group. The proportion of stunted individuals (smaller height-for-age z-score) was higher in the HIV-infected group than in the control group (p=0.0006). No significant correlation between zinc levels and short stature was found.
Anthropometric characteristics, nutritional status, and virological and immunological assessment of HIV-infected (n=51) and control (n=32) groups.
| HIV-infected | Control | p value | |
|---|---|---|---|
| Age (years)a,b | 8.3 (7.4–9.4) | 9.1 (8.4–9.7) | 0.0110b |
| Malec,d | 31 (60.8) | 18 (56.2) | 0.6830 |
| BMIc(kg/m2)a,b | 15.5 (14.7–16.6) | 16.2 (14.9–17.6) | 0.1536 |
| BMIz-scoreb,e,f | −0.18 (−0.91 to 0.39) | −0.08 (−0.76 to 0.54) | 0.4402 |
| Height for agez-scoreb,f | −1.05 (−1.55 to −0.23) | −0.24 (−0.80 to 0.72) | 0.0006 |
| Nutritional statusf | |||
| Stuntingf,g | 6 (11.8) | 0 (0) | 0.0470 |
| Eutrophicf,g | 45 (88.2) | 28 (87.5) | 0.4280 |
| Overweight+obesityf | 4 (7.8) | 4 (12.5) | |
| Undernutritionf | 2 (3.9) | 0 (0) | |
| Immunological parameters | |||
| Viral load (log10)a | 3.483 (0–4.500) | NA | |
| CD4 (%)a | 31.3 (24.9–38.1) | ||
| Antiretroviral therapy | |||
| Age of ART initiation (months)a | 21 (11–36) | NA | |
| Duration of ART (months)a | 100.8 (64.9–85.5) | NA | |
NA, not applicable; ART, antiretroviral therapy.
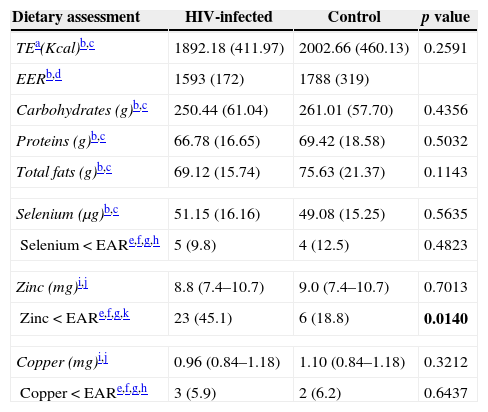
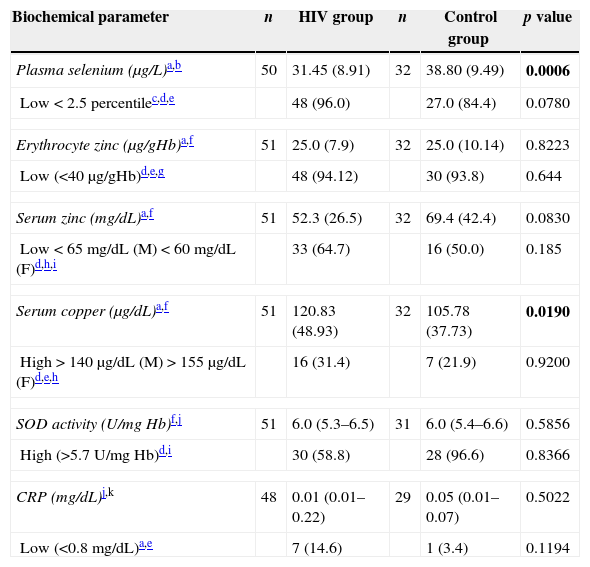
The macro- and micronutrient intakes are shown in Table 2. There was higher percentage of subjects (45.1%) in the HIV-infected group with dietary zinc intake below the EAR (p=0.014) and no statistically significant differences between groups with respect to macronutrients (g), selenium and copper consumption. HIV-infected group presented lower plasma selenium (p=0.0006) and higher copper levels when compared to the control group (p=0.019). Moreover, no difference was found concerning SOD activity or erythrocyte and serum zinc levels (Table 3). There were no significant differences in the concentration of trace elements according to different clinical and immunological categories of AIDS.
Dietary assessment of energy, macronutrients and micronutrients of HIV-infected (n=51) and control (n=32) groups.
| Dietary assessment | HIV-infected | Control | p value |
|---|---|---|---|
| TEa(Kcal)b,c | 1892.18 (411.97) | 2002.66 (460.13) | 0.2591 |
| EERb,d | 1593 (172) | 1788 (319) | |
| Carbohydrates (g)b,c | 250.44 (61.04) | 261.01 (57.70) | 0.4356 |
| Proteins (g)b,c | 66.78 (16.65) | 69.42 (18.58) | 0.5032 |
| Total fats (g)b,c | 69.12 (15.74) | 75.63 (21.37) | 0.1143 |
| Selenium (μg)b,c | 51.15 (16.16) | 49.08 (15.25) | 0.5635 |
| Selenium<EARe,f,g,h | 5 (9.8) | 4 (12.5) | 0.4823 |
| Zinc (mg)i,j | 8.8 (7.4–10.7) | 9.0 (7.4–10.7) | 0.7013 |
| Zinc<EARe,f,g,k | 23 (45.1) | 6 (18.8) | 0.0140 |
| Copper (mg)i,j | 0.96 (0.84–1.18) | 1.10 (0.84–1.18) | 0.3212 |
| Copper<EARe,f,g,h | 3 (5.9) | 2 (6.2) | 0.6437 |
Biochemical parameters of HIV-infected and control groups.
| Biochemical parameter | n | HIV group | n | Control group | p value |
|---|---|---|---|---|---|
| Plasma selenium (μg/L)a,b | 50 | 31.45 (8.91) | 32 | 38.80 (9.49) | 0.0006 |
| Low<2.5 percentilec,d,e | 48 (96.0) | 27.0 (84.4) | 0.0780 | ||
| Erythrocyte zinc (μg/gHb)a,f | 51 | 25.0 (7.9) | 32 | 25.0 (10.14) | 0.8223 |
| Low (<40μg/gHb)d,e,g | 48 (94.12) | 30 (93.8) | 0.644 | ||
| Serum zinc (mg/dL)a,f | 51 | 52.3 (26.5) | 32 | 69.4 (42.4) | 0.0830 |
| Low<65mg/dL (M)<60mg/dL (F)d,h,i | 33 (64.7) | 16 (50.0) | 0.185 | ||
| Serum copper (μg/dL)a,f | 51 | 120.83 (48.93) | 32 | 105.78 (37.73) | 0.0190 |
| High>140μg/dL (M)>155μg/dL (F)d,e,h | 16 (31.4) | 7 (21.9) | 0.9200 | ||
| SOD activity (U/mg Hb)f,j | 51 | 6.0 (5.3–6.5) | 31 | 6.0 (5.4–6.6) | 0.5856 |
| High (>5.7U/mg Hb)d,i | 30 (58.8) | 28 (96.6) | 0.8366 | ||
| CRP (mg/dL)j,k | 48 | 0.01 (0.01–0.22) | 29 | 0.05 (0.01–0.07) | 0.5022 |
| Low (<0.8mg/dL)a,e | 7 (14.6) | 1 (3.4) | 0.1194 | ||
F, female; M, male.
Progression of HIV infection and adverse health effects of antiretroviral medication lead to a chronic inflammatory condition and to impaired immune system in the child. It is therefore crucial to evaluate and monitor the antioxidant defense mechanisms that might influence the progression of HIV infection.20,21
In this study, the HIV-infected group had a higher proportion of stunting (11.8%) than the control group. Inadequate growth in HIV-infected children can be directly caused by viral infection or indirectly by adverse environmental effects or by a combination. The groups did neither differ in energy nor in macronutrients intake.
Children frequently consume monotonous diets characterized by high intakes of simple carbohydrates, saturated and trans-fats (e.g., sugar, artificial juices, sweets, sausages and fries). Compared to the control group, the HIV-infected children had the highest proportion of subjects with zinc intakes below the EAR; however no association with zinc biochemical parameters was found. This result can be explained by the low consumption of protein that is rich in zinc.
Lower selenium levels were found in the HIV infected group. These results suggest that the low plasma selenium of the HIV-infected group could be associated with increased requirement for antioxidants to neutralize oxidative stress. Plasma selenium level is a sensitive indicator of disease progression and risk of mortality in HIV-infected children.4,22 It maintains a healthy immune system, acts as an antioxidant and might regulate viral expression.4 Selenium deficiency was associated with higher mortality risk regardless of the CD4+ T cell count4 and may be related to protein-energy malnutrition commonly found in HIV-infected patients.1
A study found no selenium deficiency in healthy and HIV-infected adolescents; however, immune function assessed by plasma neopterin concentration was negatively correlated with plasma selenium levels.23 Poor selenium intakes and malabsorption may contribute to selenium deficiency, which affects the immune system and the cardiac muscle of HIV-infected subjects.1
The HIV-infected group had higher serum copper level. Moreno et al. found higher serum copper concentrations in HIV-infected subjects regardless of gender when compared to the healthy controls. These results suggest that copper is an acute phase reactant and its serum concentration can be used as a surrogate marker for HIV progression, as well as in other chronic infections and inflammatory diseases.24 Serum copper levels are not good markers of the inflammatory response because the concentration of this micronutrient appears to reflect interactions among different pathological processes.25 Because of its participation in LDL-c oxidation within artery walls, under and overconsumption of copper can result in atherogenesis.26,27 However, copper is a constituent of SOD and ceruloplasmin, which are involved in preventing oxidative stress.26,27
The CRP level was not significantly different between the groups; therefore, it was not possible to characterize the acute inflammatory process in the children. This result may be explained by the fact that, despite having moderate or severe clinical and immunological categories, the children were not hospitalized or presented severe clinical complications in the year prior to entering the study.
Our study had a small number of subjects in the HIV-infected and HIV-uninfected groups, which limits the extrapolation of our findings to other HIV-infected children. However, our HIV-infected and control populations were from the same families; therefore they had similar food access.
HIV-infected children can be exposed to numerous risk factors that impair their immune function, including inadequate nutritional status for trace elements, which could influence the progression of HIV infection. Assessing dietary intake and biochemical parameters are essential in the clinical practice in order to identify and treat early micronutrients deficiency minimizing clinical and metabolic alterations.
ContributionsCamila Pugliese – this article is a result of MSc dissertation – contributed to conception and design of the study, acquisition of data, micronutrient assessment, analysis and interpretation of data, drafting the article, and final approval of the version to be published.
Rose Vega Patin contributed to conception and design of the study, acquisition of data, analysis and interpretation of data, drafting the article, important intellectual content, and final approval of the version to be published.
Cecilia Zanin Palchetti contributed to conception and design of the study, acquisition of data, interpretation of data, drafting the article, important intellectual content, and final approval of the version to be published.
Cristiane Chiantelli Claudio contributed to conception and design of the study, acquisition of data, interpretation of data, drafting the article, and final approval of the version to be published.
Aida de Fátima Thomé Barbosa Gouvêa contributed to acquisition of medical data, important intellectual content, and final approval of the version to be published.
Regina Célia de Menezes Succi contributed to conception and design of the study, interpretation of data, drafting the article, important intellectual content, and final approval of the version to be published.
Olga Maria Silverio Amancio contributed to micronutrient assessment, interpretation of data, important intellectual content, and final approval of the version to be published.
Silvia Maria Franciscato Cozzolino contributed to micronutrient assessment, interpretation of data, important intellectual content and final approval of the version to be published.
Fernanda Luisa Ceragioli Oliveira contributed to conception and design of the study, analysis and interpretation of data, drafting the article, important intellectual content, and final approval of the version to be published.
Conflicts of interestThe authors declare no conflicts of interest.
We are grateful to the families and the children for participating in this study and to the research teams of the Division of Nutrology, Department of Pediatrics, Universidade Federal de São Paulo – UNIFESP/EPM, Brazil and of the Nutrition and Minerals Laboratory, Faculdade de Ciências Farmacêuticas, Universidade de São Paulo, USP, Brazil.
