The clinical presentations and disease courses of patients hospitalized with either influenza A virus subtype H7N9 (H7N9) or 2009 pandemic H1N1 influenza virus were compared in a recent report, but associated cardiac complications remain unclear. The present retrospective study investigated whether cardiac complications in critically ill patients with H7N9 infections differed from those infected with the pandemic H1N1 influenza virus strain.
MethodsSuspect cases were confirmed by reverse transcription polymerase chain reaction assays with specific confirmation of the pandemic H1N1 strain at the Centers for Disease Control and Prevention. Comparisons were conducted at the individual-level data of critically ill patients hospitalized with H7N9 (n=24) or pandemic H1N1 influenza virus (n=22) infections in Suzhou, China. Changes in cardiac biochemical markers, echocardiography, and electrocardiography during hospitalization in the intensive care unit were considered signs of cardiac complications.
ResultsThe following findings were more common among the H7N9 group relative to the pandemic H1N1 influenza virus group: greater tricuspid regurgitation pressure gradient, sinus tachycardia (heartbeat≥130bpm), ST segment depression, right ventricular dysfunction, and elevated cardiac biochemical markers. Pericardial effusion was more often found among pandemic H1N1 influenza virus patients than in the H7N9 group. In both groups, most of the cardiac complications were detected from day 6 to 14 after the onset of influenza symptoms. Those who developed cardiac complications were especially vulnerable during the first four days after initiation of mechanical ventilation. Cardiac complications were reversible in the vast majority of discharged H7N9 patients.
ConclusionsCritically ill hospitalized H7N9 patients experienced a higher rate of cardiac complications than did patients with 2009 pandemic H1N1 influenza virus infections, with the exception of pericardial effusion. This study may help in the prevention, identification, and treatment of influenza-induced cardiac complications in both pandemic H1N1 influenza virus and H7N9 infections.
The emergence of human infections by avian influenza A subtype H7N9 (H7N9) has widened the spectrum of influenza A viruses that currently threaten public health.1,2 Reported complications of H7N9 infection include acute respiratory distress syndrome (ARDS), shock, acute kidney injury, and rhabdomyolysis. Yet, less is known about important cardiac complications related to this virus.2
Acute infection with other strains of influenza has been associated with numerous cardiac complications, including myocardial infarction, myopericarditis, arrhythmias, congestive heart failure, and sudden death.3,4 Rates of cardiac changes have ranged from 15% to 43% in influenza A ambulatory patients, and from 14% to 75% in hospitalized patients.5–7 The few relevant case reports8–11 indicate that myocarditis and pericarditis may be important cardiac abnormalities in pandemic H1N1 influenza virus (pH1N1) infection. In these case reports, heart dysfunctions were demonstrated by abnormalities in creatine kinase (CK), CK-isoenzyme MB (CK-MB), troponin I, electrocardiogram (ECG), and echocardiogram (ECHO).
It remains unclear whether differing strains of influenza affect the cardiovascular system in distinct ways. Accordingly, we hypothesized that cardiac complications of acute influenza infection may differ among patients hospitalized with H7N9 or pH1N1 strains; and these differences would be magnified in critically ill patients. The present retrospective study investigated whether cardiac complications in hospitalized critically ill patients with H7N9 infections differed from those infected with the pH1N1 strain of influenza A.
MethodsDate sourcesThe Ethics Committee of First Affiliated Hospital, College of Medicine, Soochow University, approved this retrospective study. All diagnoses of H7N9 (between March 2013 and July 2014) and pH1N1 (between April 2009 and January 2010) infection in the patients enrolled in our study were confirmed by reverse transcription polymerase chain reaction assays from throat swab specimens or respiratory tract samples. All patients who received a diagnosis of pH1N1 infection also received confirmation of the pandemic H1N1 strain at the Centers for Disease Control and Prevention. None of the patients enrolled in this study had a history of preexisting heart disease, none were pregnant during the influenza epidemic seasons, and all were hospitalized in the intensive care unit (ICU). Assessments of the clinical condition were conducted upon admission to the ICU. Therapies that were used before admission were also recorded.
The clinical condition assessment consisted of routine blood tests, biochemical indicators, computed tomography (CT), and ratio of partial pressure arterial oxygen (PaO2) to fraction of inspired oxygen (FiO2) in the H7N9 and pH1N1 groups (i.e., PaO2/FiO2). The Clinical Pulmonary Infection Score (CPIS) and SMART-COP score were calculated to evaluate the severity of pneumonia.12,13 The Acute Physiology and Chronic Health Evaluation II (Apache II) and the Sequential Organ Failure Assessment (SOFA) were also assessed for all patients to indicate severity of illness.14,15 Data regarding pre-admission therapies included antiviral drugs, time from onset to antiviral therapy, and duration and parameters of mechanical ventilation.
The participants underwent ECG and ECHO examinations within 24hours of admission, and peripheral blood was collected to assess cardiac enzyme levels within 48h. During the patients’ hospitalizations, potential cardiac complications were assessed routinely with cardiac enzymes, ECHO, and ECG, and the following were also monitored: chest pain, hemodynamic instability, tachycardia, pulmonary crackles, dyspnea, and oxygen saturation. Abnormalities were reassessed periodically, generally every 3–5 days, until stabilization, resolution, or death.
The transthoracic ECHO evaluations were performed with a Vivid I Ultrasound scanner (General Electric, Tirat Carmel, Israel). The image acquisition and description were performed by the same sonographer who was blinded to the condition of the patients, and the results of ECG were interpreted by the same cardiologist who was also blinded to the condition. To evaluate the specificity of adverse cardiac events, we defined cardiac dysfunction as either ECHO changes or ECG changes coupled with cardiac biomarkers elevation in the same patient. We conducted a follow-up at one year of the discharged H7N9 patients, and the results of the ECG and ECHO were also recorded.
Statistical analysisAll values are reported as mean±standard deviation, and frequency data are shown as n (%). Independent sample t-tests were used for mean comparisons and the chi-squared test was used for frequency comparisons between the two groups. All statistical analyses were performed using SPSS version 13.0 software. A p-value <0.05 was considered significant.
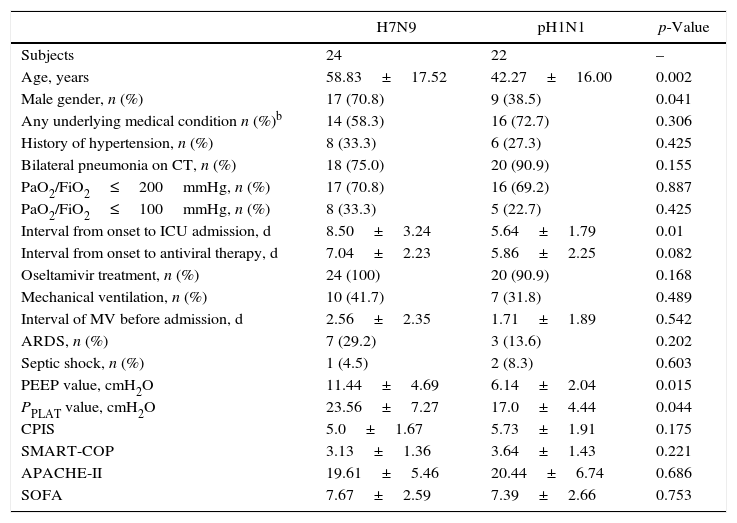
ResultsPatient characteristicsThis study included 46 critically ill patients admitted to the ICU, 24 with H7N9 (ages 58.83±17.52 y) and 22 with pH1N1 (42.27±16.00 y) infections (Table 1). The percentage of men in the H7N9 group (70.8%) was higher than that of the pH1N1 group (38.5%). The two groups were statistically comparable with regard to underlying medical conditions, PaO2/FiO2, and bilateral lung involvement on CT.
Clinical characteristics of hospitalized patients with H7N9 and pH1N1 upon ICU admission.a
| H7N9 | pH1N1 | p-Value | |
|---|---|---|---|
| Subjects | 24 | 22 | – |
| Age, years | 58.83±17.52 | 42.27±16.00 | 0.002 |
| Male gender, n (%) | 17 (70.8) | 9 (38.5) | 0.041 |
| Any underlying medical condition n (%)b | 14 (58.3) | 16 (72.7) | 0.306 |
| History of hypertension, n (%) | 8 (33.3) | 6 (27.3) | 0.425 |
| Bilateral pneumonia on CT, n (%) | 18 (75.0) | 20 (90.9) | 0.155 |
| PaO2/FiO2≤200mmHg, n (%) | 17 (70.8) | 16 (69.2) | 0.887 |
| PaO2/FiO2≤100mmHg, n (%) | 8 (33.3) | 5 (22.7) | 0.425 |
| Interval from onset to ICU admission, d | 8.50±3.24 | 5.64±1.79 | 0.01 |
| Interval from onset to antiviral therapy, d | 7.04±2.23 | 5.86±2.25 | 0.082 |
| Oseltamivir treatment, n (%) | 24 (100) | 20 (90.9) | 0.168 |
| Mechanical ventilation, n (%) | 10 (41.7) | 7 (31.8) | 0.489 |
| Interval of MV before admission, d | 2.56±2.35 | 1.71±1.89 | 0.542 |
| ARDS, n (%) | 7 (29.2) | 3 (13.6) | 0.202 |
| Septic shock, n (%) | 1 (4.5) | 2 (8.3) | 0.603 |
| PEEP value, cmH2O | 11.44±4.69 | 6.14±2.04 | 0.015 |
| PPLAT value, cmH2O | 23.56±7.27 | 17.0±4.44 | 0.044 |
| CPIS | 5.0±1.67 | 5.73±1.91 | 0.175 |
| SMART-COP | 3.13±1.36 | 3.64±1.43 | 0.221 |
| APACHE-II | 19.61±5.46 | 20.44±6.74 | 0.686 |
| SOFA | 7.67±2.59 | 7.39±2.66 | 0.753 |
Treatment dates, with respect to viral-load kinetics, were available for patients who had received antiviral agents. The H7N9 and pH1N1 groups were similar regarding the number of days from onset of symptoms to antiviral therapy, and also the number of days on mechanical ventilation prior to ICU admission (Table 1). Antiviral therapy consisted of oseltamivir at a daily dose of 150mg, for patients who received it. Every H7N9 patient in the H7N9 group received antiviral therapy, compared to only 90.9% of pH1N1 patients. Mechanical ventilation on admission was required by 41.7% and 31.8% of the H7N9 and pH1N1 patients, respectively. Positive end-expiratory pressure (PEEP) and plateau airway pressure (PPLAT) values of the H7N9 patients were significantly higher than that of the pH1N1 group.
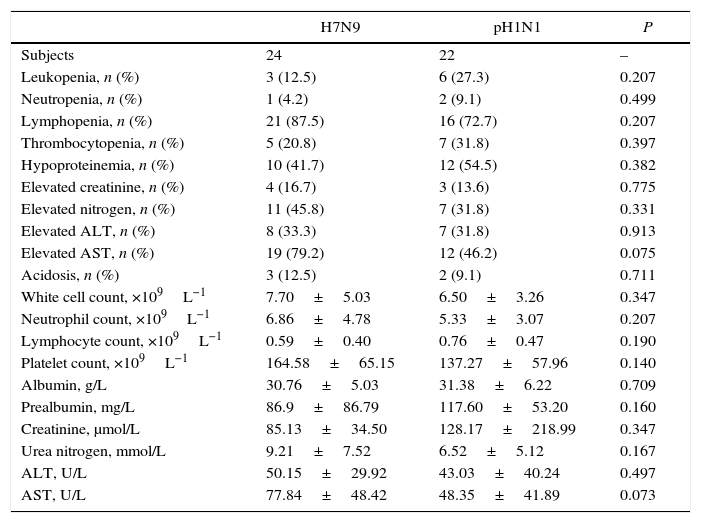
Severity of illnessCPIS, SMART-COP, APACHE-II, and SOFA scores reflect the severity of pneumonia and organ injury. There were no significant differences in CPIS, SMART-COP, APACHE-II, or SOFA scores between the H7N9 and pH1N1 patients (Table 1). The routine peripheral blood results also showed no significant differences between these groups (Table 2).
Laboratory results of hospitalized patients with H7N9 and pH1N1 upon ICU admission.a
| H7N9 | pH1N1 | P | |
|---|---|---|---|
| Subjects | 24 | 22 | – |
| Leukopenia, n (%) | 3 (12.5) | 6 (27.3) | 0.207 |
| Neutropenia, n (%) | 1 (4.2) | 2 (9.1) | 0.499 |
| Lymphopenia, n (%) | 21 (87.5) | 16 (72.7) | 0.207 |
| Thrombocytopenia, n (%) | 5 (20.8) | 7 (31.8) | 0.397 |
| Hypoproteinemia, n (%) | 10 (41.7) | 12 (54.5) | 0.382 |
| Elevated creatinine, n (%) | 4 (16.7) | 3 (13.6) | 0.775 |
| Elevated nitrogen, n (%) | 11 (45.8) | 7 (31.8) | 0.331 |
| Elevated ALT, n (%) | 8 (33.3) | 7 (31.8) | 0.913 |
| Elevated AST, n (%) | 19 (79.2) | 12 (46.2) | 0.075 |
| Acidosis, n (%) | 3 (12.5) | 2 (9.1) | 0.711 |
| White cell count, ×109L−1 | 7.70±5.03 | 6.50±3.26 | 0.347 |
| Neutrophil count, ×109L−1 | 6.86±4.78 | 5.33±3.07 | 0.207 |
| Lymphocyte count, ×109L−1 | 0.59±0.40 | 0.76±0.47 | 0.190 |
| Platelet count, ×109L−1 | 164.58±65.15 | 137.27±57.96 | 0.140 |
| Albumin, g/L | 30.76±5.03 | 31.38±6.22 | 0.709 |
| Prealbumin, mg/L | 86.9±86.79 | 117.60±53.20 | 0.160 |
| Creatinine, μmol/L | 85.13±34.50 | 128.17±218.99 | 0.347 |
| Urea nitrogen, mmol/L | 9.21±7.52 | 6.52±5.12 | 0.167 |
| ALT, U/L | 50.15±29.92 | 43.03±40.24 | 0.497 |
| AST, U/L | 77.84±48.42 | 48.35±41.89 | 0.073 |
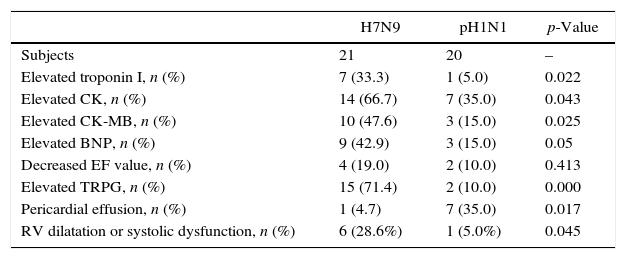
The incidence of cardiac events was 70.8% and 45.5% in the H7N9 and pH1N1 groups, respectively. The rates for the following elevated cardiac biomarkers were significantly higher among H7N9 patients than in the pH1N1 group (Table 3): troponin I, CK, CK-MB, and brain natriuretic peptide (BNP). Pericardial effusion was detected significantly less in the H7N9 group than the pH1N1 group.
Cardiac biomarkers and echocardiography changes in hospitalized patients with H7N9 and pH1N1.a
| H7N9 | pH1N1 | p-Value | |
|---|---|---|---|
| Subjects | 21 | 20 | – |
| Elevated troponin I, n (%) | 7 (33.3) | 1 (5.0) | 0.022 |
| Elevated CK, n (%) | 14 (66.7) | 7 (35.0) | 0.043 |
| Elevated CK-MB, n (%) | 10 (47.6) | 3 (15.0) | 0.025 |
| Elevated BNP, n (%) | 9 (42.9) | 3 (15.0) | 0.05 |
| Decreased EF value, n (%) | 4 (19.0) | 2 (10.0) | 0.413 |
| Elevated TRPG, n (%) | 15 (71.4) | 2 (10.0) | 0.000 |
| Pericardial effusion, n (%) | 1 (4.7) | 7 (35.0) | 0.017 |
| RV dilatation or systolic dysfunction, n (%) | 6 (28.6%) | 1 (5.0%) | 0.045 |
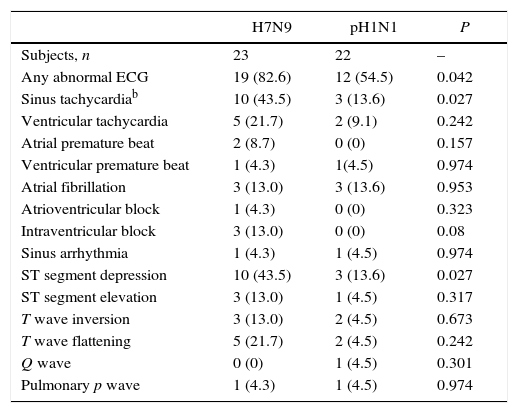
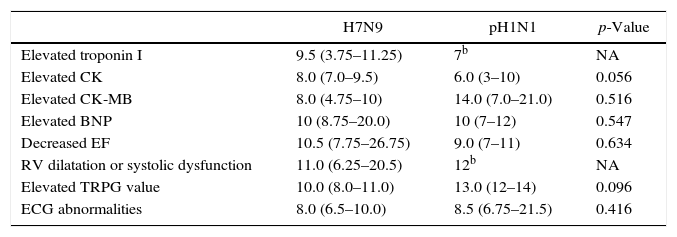
The presence of any ECG changes was identified more frequently in H7N9 patients than in pH1N1 patients (Table 4); the rates of sinus tachycardia and ST segment depression were significantly higher in H7N9 patients. The median time interval from onset of influenza infection to identification of decreased ejection fraction was 10.5 days and 9.0 days in the H7N9 and pH1N1 patients, respectively (Table 5). The median time interval from influenza onset to cardiac biomarkers (troponin I, CK, CK-MB, and BNP), ECHO, and ECG abnormality in the H7N9 and pH1N1 groups were 8–11 days and 6–14 days, respectively.
ECG changes in hospitalized patients with H7N9 and pH1N1.a
| H7N9 | pH1N1 | P | |
|---|---|---|---|
| Subjects, n | 23 | 22 | – |
| Any abnormal ECG | 19 (82.6) | 12 (54.5) | 0.042 |
| Sinus tachycardiab | 10 (43.5) | 3 (13.6) | 0.027 |
| Ventricular tachycardia | 5 (21.7) | 2 (9.1) | 0.242 |
| Atrial premature beat | 2 (8.7) | 0 (0) | 0.157 |
| Ventricular premature beat | 1 (4.3) | 1(4.5) | 0.974 |
| Atrial fibrillation | 3 (13.0) | 3 (13.6) | 0.953 |
| Atrioventricular block | 1 (4.3) | 0 (0) | 0.323 |
| Intraventricular block | 3 (13.0) | 0 (0) | 0.08 |
| Sinus arrhythmia | 1 (4.3) | 1 (4.5) | 0.974 |
| ST segment depression | 10 (43.5) | 3 (13.6) | 0.027 |
| ST segment elevation | 3 (13.0) | 1 (4.5) | 0.317 |
| T wave inversion | 3 (13.0) | 2 (4.5) | 0.673 |
| T wave flattening | 5 (21.7) | 2 (4.5) | 0.242 |
| Q wave | 0 (0) | 1 (4.5) | 0.301 |
| Pulmonary p wave | 1 (4.3) | 1 (4.5) | 0.974 |
Interval (days) from onset of symptoms to development of adverse cardiac events in patients with H7N9 and pH1N1.a
| H7N9 | pH1N1 | p-Value | |
|---|---|---|---|
| Elevated troponin I | 9.5 (3.75–11.25) | 7b | NA |
| Elevated CK | 8.0 (7.0–9.5) | 6.0 (3–10) | 0.056 |
| Elevated CK-MB | 8.0 (4.75–10) | 14.0 (7.0–21.0) | 0.516 |
| Elevated BNP | 10 (8.75–20.0) | 10 (7–12) | 0.547 |
| Decreased EF | 10.5 (7.75–26.75) | 9.0 (7–11) | 0.634 |
| RV dilatation or systolic dysfunction | 11.0 (6.25–20.5) | 12b | NA |
| Elevated TRPG value | 10.0 (8.0–11.0) | 13.0 (12–14) | 0.096 |
| ECG abnormalities | 8.0 (6.5–10.0) | 8.5 (6.75–21.5) | 0.416 |
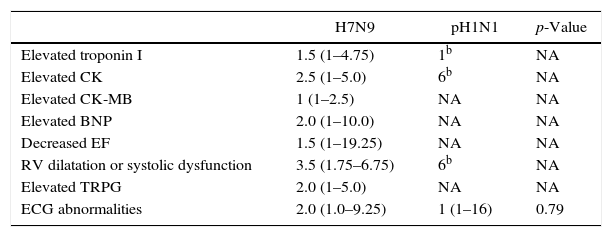
The median time interval from initiation of mechanical ventilation to a decrease in ejection fraction in the H7N9 group was 1.5 days (Table 6). In addition, the changes in cardiac biomarkers, ECG, and another ECHO index were found less than four days (median time) after initiation of mechanical ventilation. We could not calculate the median time from mechanical ventilation to the above index changes due to insufficient data in the pH1N1 group. Data regarding cardiac enzymes and ECHO were not available for three H7N9 patients and two pH1N1 patients, and ECG data was not available for one H7N9 patient. For both groups, most of the cardiac complications were detected between days six and 14 after onset of symptoms. The first four days after initiation of mechanical ventilation showed the highest incidence of cardiac complications during hospitalization.
Interval (days) from mechanical ventilation initiation to development of adverse cardiac events in patients with H7N9 and pH1N1.a
| H7N9 | pH1N1 | p-Value | |
|---|---|---|---|
| Elevated troponin I | 1.5 (1–4.75) | 1b | NA |
| Elevated CK | 2.5 (1–5.0) | 6b | NA |
| Elevated CK-MB | 1 (1–2.5) | NA | NA |
| Elevated BNP | 2.0 (1–10.0) | NA | NA |
| Decreased EF | 1.5 (1–19.25) | NA | NA |
| RV dilatation or systolic dysfunction | 3.5 (1.75–6.75) | 6b | NA |
| Elevated TRPG | 2.0 (1–5.0) | NA | NA |
| ECG abnormalities | 2.0 (1.0–9.25) | 1 (1–16) | 0.79 |
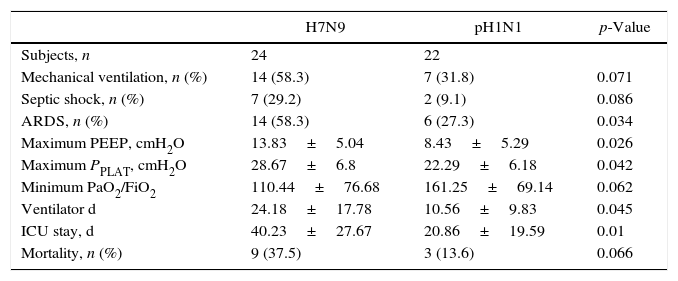
All of the 46 patients in this study were directly admitted to the ICU (Table 7). Fourteen H7N9 patients (58.3%) and six pH1N1 patients (27.3%) suffered from ARDS. Of the patients with respiratory failure, 58.3% and 31.8% of the H7N9 and pH1N1 groups, respectively, required invasive mechanical ventilation. Notably, the number of days on mechanical ventilation, and the maximum PEEP and PPLAT values, were significantly higher in the H7N9 group compared with the pH1N1 group, and the minimum PaO2/FiO2 was lower. The mean ICU length of stay of the H7N9 patients was significantly longer than that of the pH1N1 group (p=0.01). The mortality rates of the two groups were similar (p=0.066).
Clinical characteristics of patients with H7N9 and PH1N1 during hospitalization.a
| H7N9 | pH1N1 | p-Value | |
|---|---|---|---|
| Subjects, n | 24 | 22 | |
| Mechanical ventilation, n (%) | 14 (58.3) | 7 (31.8) | 0.071 |
| Septic shock, n (%) | 7 (29.2) | 2 (9.1) | 0.086 |
| ARDS, n (%) | 14 (58.3) | 6 (27.3) | 0.034 |
| Maximum PEEP, cmH2O | 13.83±5.04 | 8.43±5.29 | 0.026 |
| Maximum PPLAT, cmH2O | 28.67±6.8 | 22.29±6.18 | 0.042 |
| Minimum PaO2/FiO2 | 110.44±76.68 | 161.25±69.14 | 0.062 |
| Ventilator d | 24.18±17.78 | 10.56±9.83 | 0.045 |
| ICU stay, d | 40.23±27.67 | 20.86±19.59 | 0.01 |
| Mortality, n (%) | 9 (37.5) | 3 (13.6) | 0.066 |
The one-year follow-up was completed for nine of 11 discharged H7N9 patients who had evidence of one or more cardiac complications during hospitalization. One subject was lost to follow-up and one died of renal failure. Cardiac abnormalities that were observed during hospitalization primarily included tachycardia, atrial fibrillation, and ST changes. All of these parameters had returned to normal at follow-up. An elevated tricuspid regurgitation pressure gradient (TRPG) was found in four of these individuals during hospitalization, which returned to normal in three of them.
DiscussionThis retrospective study investigated whether the cardiac complications of patients admitted to the ICU with H7N9 infections differed from those infected by the pH1N1 strain of influenza A. We found that acute H7N9 infection can result in severe cardiac complications, and a higher proportion of H7N9 patients experienced cardiac complications, except for pericardial effusion, than did the patients with 2009 pH1N1 infections. Most cardiac complications were detected between days six and 14 in both groups after onset of disease, and the first four days of mechanical ventilation appeared to be a period of greater risk for the development of cardiac complications in susceptible individuals. The results of patient follow-up indicate that cardiac complications are reversible in the majority of H7N9 patients who outlived the infection. Collectively, these data suggest that cardiac complications associated with acute influenza H7N9 and pH1N1 infections differ. These differences may help clinicians identify and treat these complications in a timely manner.
The clinical data of the H7N9 and pH1N1 groups obtained upon ICU admission were compared in detail. The two groups were similar except for age, gender ratio, number of days from onset of symptoms to admission, and PEEP and PPLAT values. Although the time between the onset of the disease and ICU admission was statistically higher in the H7N9 group than in the pH1N1, the treatment strategy before ICU admission was similar. Furthermore, the groups were also comparable for severity of pneumonia or organ injury according to the CPIS, SMART-COP, APACHE-II, and SOFA scoring systems. Accordingly, we consider that the lag time between onset of the disease and ICU admission had little influence on the high incidence of cardiac complications in H7N9 group.
The clinical features of hospitalized patients with H7N9 infection were generally similar to those of patients with pH1N1 infection. Patients usually presented with early fever, cough, and sputum production, with rapid progression to severe pneumonia, moderate-to-severe ARDS, and septic shock. Multiple biomarkers of myocardial injury and cardiac dysfunction were monitored in the present study, including CK, CK-MB, troponin-I, and BNP. These are minimally invasive tests with high specificity, sensitivity, and diagnostic and prognostic implications.16,17 Notably, in the present study the above biomarkers were at higher levels in the H7N9 group than the pH1N1 group.
Echocardiography is considered an ideal tool in clinical practice to evaluate cardiac function and anatomic structure. In a study by Brown et al.,18 right heart dilation was observed in 50–80% of critically ill PH1N1 patients, systolic dysfunction in 23%, and left heart failure in 17%. However, in our present cohort, the prevalence of ECHO abnormalities in pH1N1 patients was lower. It has been reported that ARDS and mechanical ventilation can contribute to cardiac insufficiency.19,20 In the present study, the rates of mechanical ventilation use and ARDS was lower than the rates reported by Brown et al. (31.8% cf. 91% and 27.3% cf. 83%, respectively) which, in part, accounts for differences in the rates of cardiac complications.
To date, the prevalence of ECHO abnormalities in H7N9 patients has not been characterized. In the present study, the H7N9 patients experienced higher rates of both right ventricular dysfunction and TRPG overload in the H7N9 group compared with the pH1N1 group. This may be partly due to the higher prevalence of ARDS in the H7N9 group, and higher PEEP requirements and PPLAT administrated. Over 50% of the patients in each group had abnormal ECG results, most of which were benign and nonspecific (tachycardia, atrial fibrillation, and ST segment changes). The degree of sinus tachycardia and ST segment depression was higher in the H7N9 group than in the pH1N1 group, suggesting a higher rate of myocardial ischemia. In a study by Liu et al.,21 congestive heart failure was identified in five of the 10 fatal H7N9 cases in Zhejiang province of China. In another study, left ventricular failure was noted in two of six hospitalized H7N9 cases in Shanghai, China.22 A decrease in left ventricular ejection fraction was found in four of the 21 H7N9 patients, while left ventricular dilatation was not found in our cohort.
There has not been a consensus regarding myocardial involvement in influenza infection, because the diagnostic criteria and patients’ clinical conditions have varied across studies.3,23 In two ICU cohorts of patients with pH1N1 infection, the prevalence of cardiovascular complications was 34% and >50%, respectively.23,24 In the present study, the overall prevalence of cardiac complications in the H7N9 and pH1N1 groups was 70.8% and 45.5%, respectively. The mechanism of cardiac involvement in influenza infection is thought to be multifactorial, including fever, vasodilatation, hypovolemia, hypoxia, proinflammatory cytokines, procoagulant effects, and direct invasion of the influenza virus.25,26
Apart from ARDS and the associated mechanical ventilation setting, the higher incidence of septic shock and older age of the H7N9 group may have influenced the higher incidence of cardiac complications in that group.27,28 Cardiac involvement in influenza has been reported to occur usually between four and nine days after the onset of influenza symptoms.29 This is similar to the median interval from onset to identification of cardiac events in our present study for both the H7N9 and pH1N1 groups (8–11 days and 6–14 days, respectively). We also noted that more than half of the H7N9 patients had cardiac events within four days after mechanical ventilation was initiated. Unfortunately, due to the small cohort, the statistical power of this observation for the pH1N1 patients is limited. The possibilities of existing heart disease and cardiac complications in H7N9 infection should be considered in the management of the disease, due to its associated increased mortality.23,30 Our present report of the substantial mortality associated with H7N9 infection confirms that the management of cardiac complications is an important issue.
In conclusion, this study shows that there are many indications of cardiac complications in influenza infections. A higher proportion of H7N9 patients experienced cardiac dysfunction compared with patients with pH1N1 infections, with the exception of pericardial effusion. In both groups, most of the cardiac complications were detected from six to 14 days after the onset of influenza symptoms. The first four days after the initiation of mechanical ventilation seemed to be the period in which susceptible patients were most vulnerable to cardiac complications. However, for the vast majority of H7N9 patients who outlived the infection, cardiac complications appear to be reversible. We identified severe cardiac complications in critically ill patients with either H7N9 or pH1N1 infections. Recognizing differences in influenza-associated cardiac complications between pH1N1 and H7N9 strains may help clinicians to identify and treat these complications early. We hope that our findings may help in the prevention, early identification, and treatment of influenza-induced cardiac complications in pH1N1 and H7N9 infections.
Conflicts of interestThe authors declare no conflicts of interest.
This work was supported by grants from the National Natural Science Foundation of China (NSFC81300040), the Natural Science Foundation of Jiangsu Province (BK20141184), China National Clinical Key Subject and Application Foundation of Suzhou China (SYS201336), and the Six Talent Peaks Project in Jiangsu Province (WSN021). We would like to thank Dr. Dustin R. Fraidenburg for his help in developing this manuscript.
