
Mycobacterium tuberculosis, the causing agent of tuberculosis, comes second only after HIV on the list of infectious agents slaughtering many worldwide. Due to the limitations behind the conventional detection methods, it is therefore critical to develop new sensitive sensing systems capable of quick detection of the infectious agent. In the present study, the surface modified cadmium-telluride quantum dots and gold nanoparticles conjunct with two specific oligonucleotides against early secretory antigenic target 6 were used to develop a sandwich-form fluorescence resonance energy transfer-based biosensor to detect M. tuberculosis complex and differentiate M. tuberculosis and M. bovis Bacille Calmette–Guerin simultaneously. The sensitivity and specificity of the newly developed biosensor were 94.2% and 86.6%, respectively, while the sensitivity and specificity of polymerase chain reaction and nested polymerase chain reaction were considerably lower, 74.2%, 73.3% and 82.8%, 80%, respectively. The detection limits of the sandwich-form fluorescence resonance energy transfer-based biosensor were far lower (10fg) than those of the polymerase chain reaction and nested polymerase chain reaction (100fg). Although the cost of the developed nanobiosensor was slightly higher than those of the polymerase chain reaction-based techniques, its unique advantages in terms of turnaround time, higher sensitivity and specificity, as well as a 10-fold lower detection limit would clearly recommend this test as a more appropriate and cost-effective tool for large scale operations.
Tuberculosis (TB) is one of the major chronic infectious diseases caused by Mycobacterium tuberculosis (MTB) and represents a global health concern.1,2 It is posing a threat even in the developed countries, because it may emerge as an obstacle of human immune deficiency syndrome.2 TB is spread in the air and can affect all parts of human body but mostly lungs.3 MTB was reported to have caused 1.4 million deaths and 8.5 million incident cases across the world only in the year 2011.3
Beside MTB, the other members of what is commonly referred to as the M. tuberculosis complex including M. africanum, M. microti, and M. bovis may also cause TB infection. The only available vaccine against MTB is the attenuated M. bovis strains or Bacille Calmette–Guerin (BCG) which causes some cross-reactivity or false-positive results during the detection process.1,4 Therefore, developing an accurate and reliable detection technique capable of differentiating infected samples from those vaccinated is also required.
On the other hand, early detection is so critical to avoid a TB epidemic. To achieve that, many techniques have been developed and widely applied to date such as bacteria's physical, physiological and biochemical characteristics as well as polymerase chain reaction (PCR)-based techniques.2,5–11 More recently WHO recommended Xpert MTB/RIF detection technique as a primary sensitive diagnostic test.12 However, all these techniques have a number of shortcomings and as a result, there is still a growing desire to accomplish a simple, rapid, sensitive and specific detection method to differentiate MTBC-infected samples from vaccinated samples with an affordable cost.2,8,11,13,14
The conserved genomic region of 6-kDa early secretory antigenic target 6 (ESAT-6) has been found of high homology among the different species of mycobacteria and has been used in the most studies to detect MTBC.15,16 On the other hand, to differentiate BCG vaccinated samples from MTB-infected samples, the ESAT-6 genomic region which is eliminated in all available BCG strains but present in the MTB complex was utilized.15,16 In addition, during the last decade, by applying nano-sized materials in biological detection and biological imaging aspects, the clinical diagnostics field has improved dramatically by developing rapid and sensitive methods at lower cost.17,18 Semiconductor nanocrystals, also known as quantum dots (QDs), are one of the most attractive fluorescent nanoparticles which have been widely applied in bio-detection processes.19 QDs are considered as alternative fluorescent probes for their unique optical properties such as high fluorescence yields, high photo-stability and narrow symmetric emission spectrum.19 Moreover, the symmetric emission spectra of QDs have nominated them as an appropriate donor molecule for Förster resonance energy transfer (FRET)-based sensors,18,20,21 in which the electronic excitation energy of a donor molecule is transferred to a nearby acceptor molecule via a dipole–dipole interaction between the donor/acceptor pair.22 Case in point, the QDs broadly used as bio-sensors by immobilizing with particular probes to detect a specific target nucleotide.23
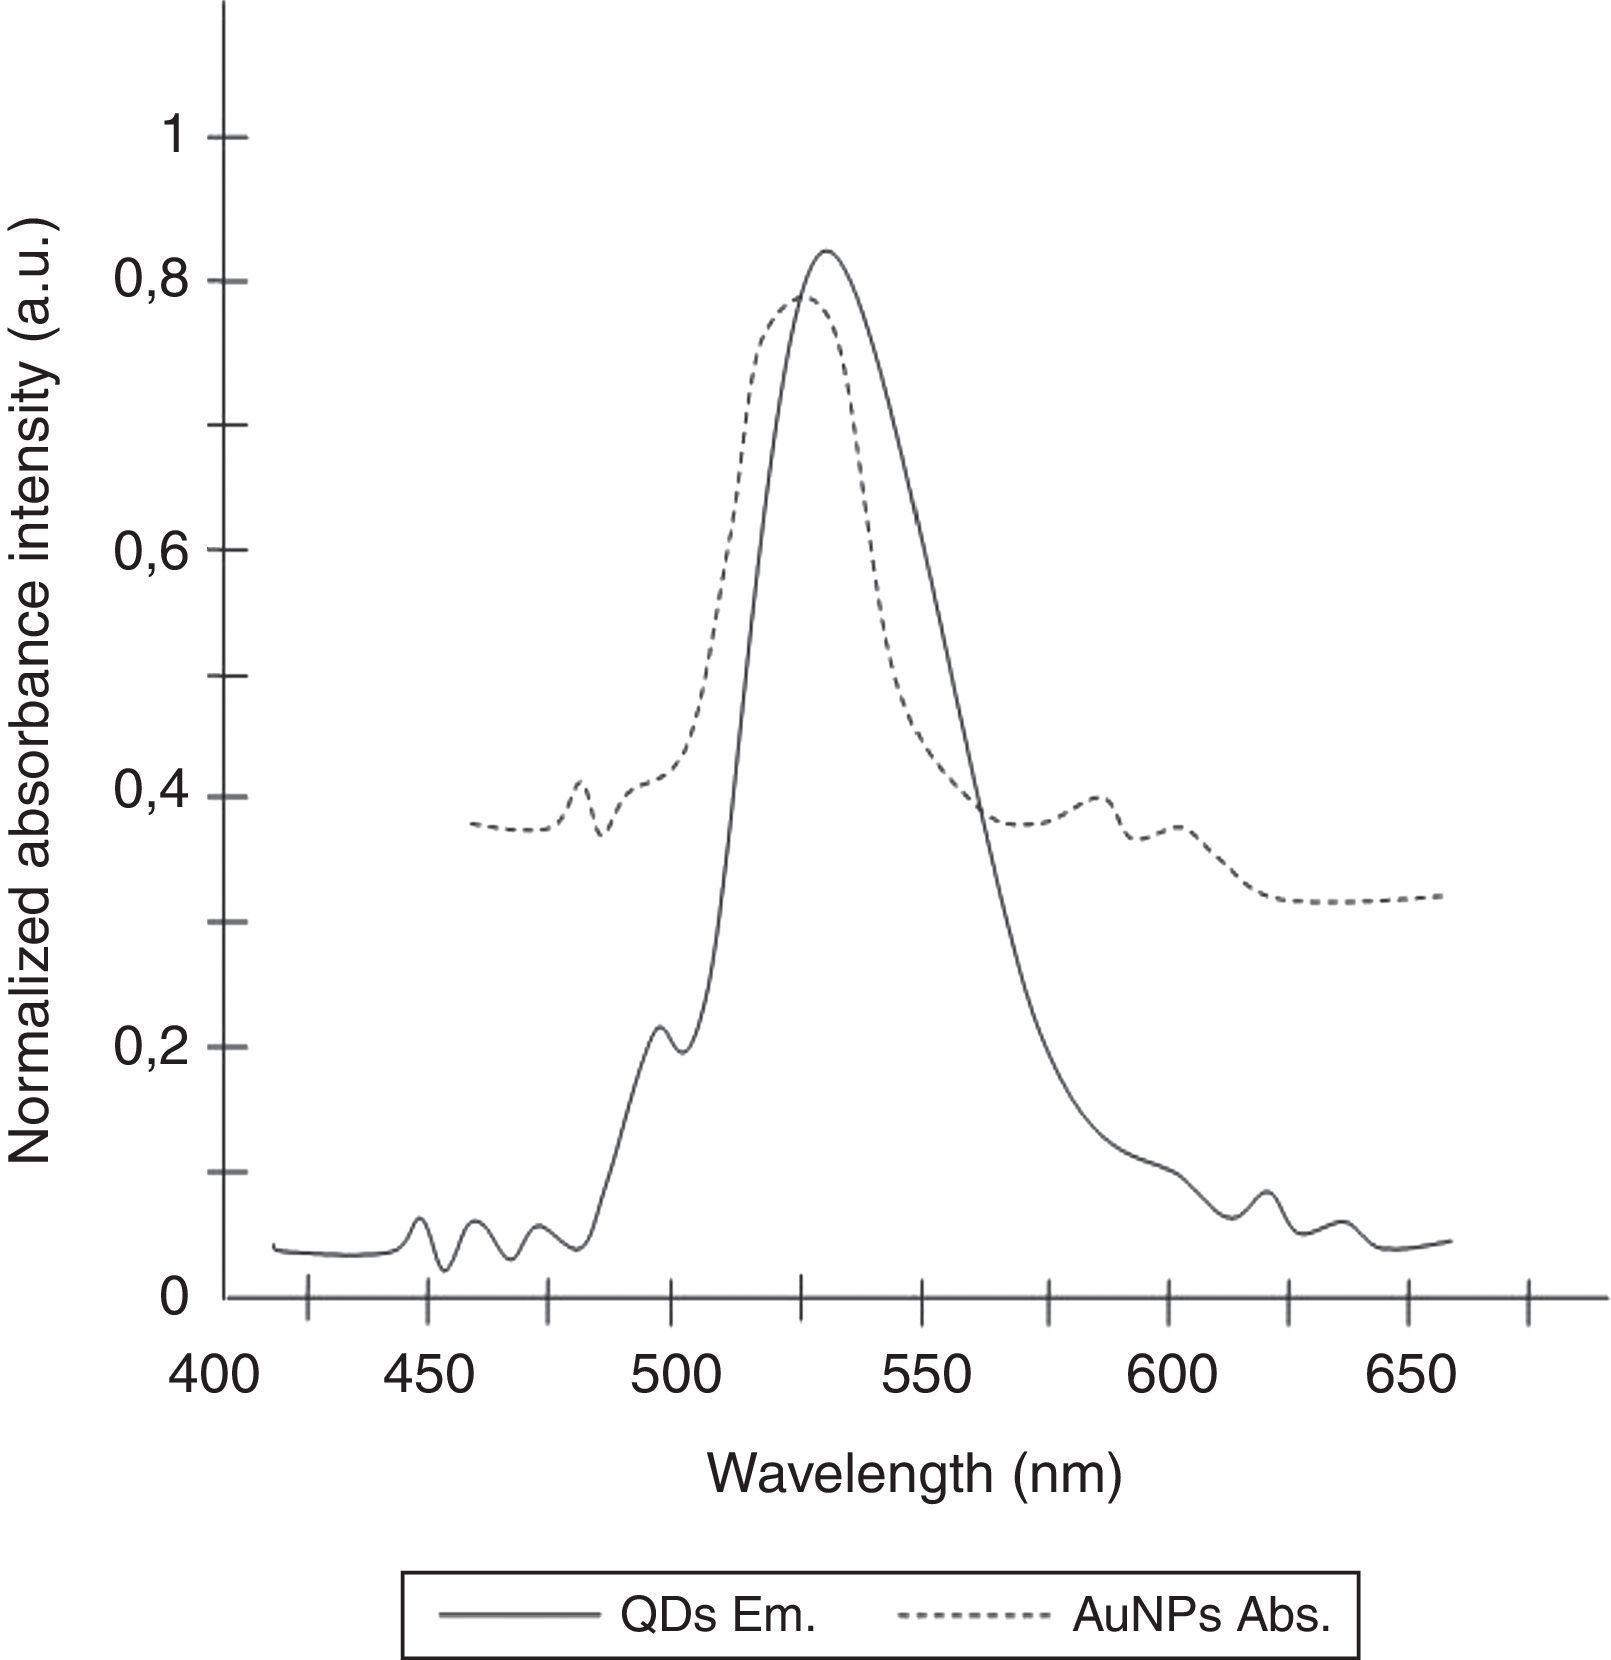
Gold nanoparticles (AuNPs) have also been utilized widely in the detection of specific RNA or DNA molecules due to their unique optical properties.24,25 AuNPs have remarkably high extinction coefficients and a broad absorption spectrum, allowing higher sensitivity in optical detection techniques than traditional dyes and designating AuNPs as a suitable acceptor for FRET.23,26 Due to the fact that, the emission and absorption spectrum of CdTe-QDs and AuNPs significantly overlap in 530nm, the emission of the QDs is quenched when associated with oppositely charged AuNPs.23,27
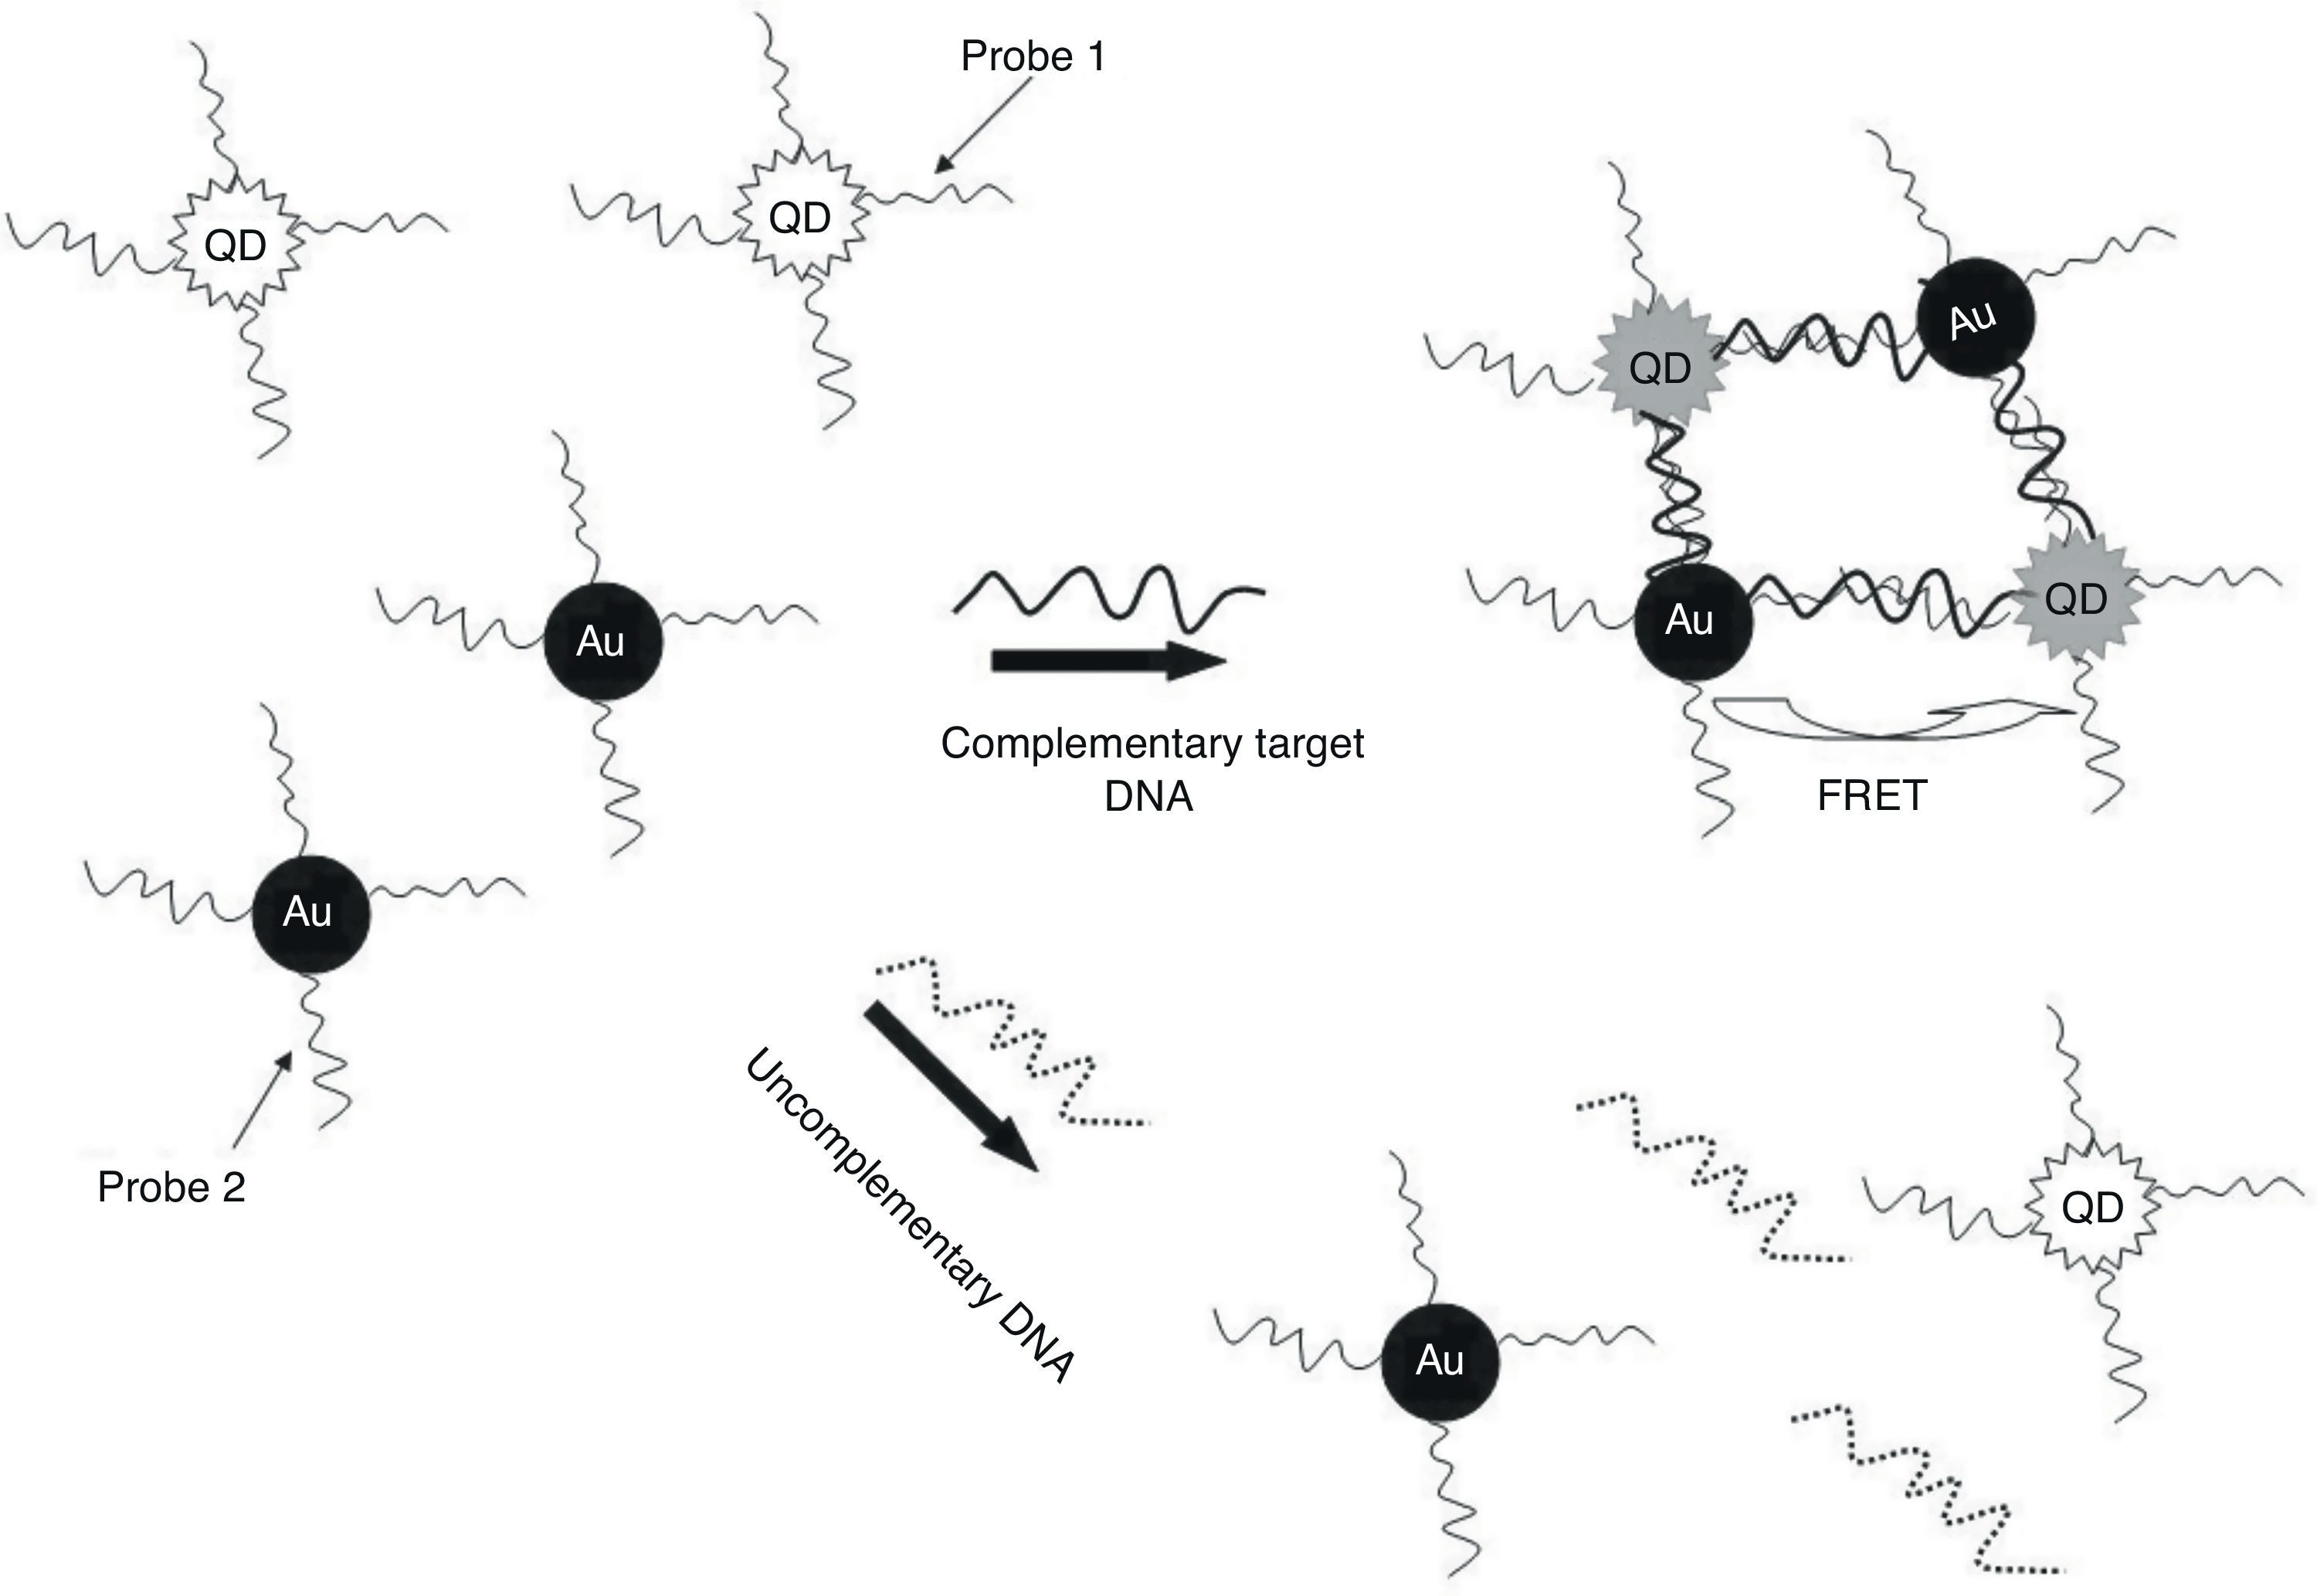
In the present study, QDs were immobilized with a specific oligonucleotide (P1) and AuNPs was conjunct with another specific oligonucleotide (P2) against ESAT-6 region to develop a specific and sensitive sandwich-form FRET-based biosensor to detect and differentiate M. tuberculosis complex from BCG rapidly, accurately, and economically (Fig. 1). Moreover, the validity of sandwich-form FRET-based biosensor in comparison with culture, PCR and Nested PCR was evaluated.
Materials and methodsSamples
In the present study, 50 clinical samples (all subjects were HIV negative) were collected from sputum specimens of patients who were suspected to have tuberculosis in Tehran province hospitals, Iran (between December of 2005 and November 2008). The used procedures in the present study were in accordance with the ethical standards of the responsible committee on human experimentation from each participating hospital. The patients have given informed prior to participating in the research. The decontamination and cultivation of samples were carried out in the hospitals. Samples were decontaminated by using N-acetylcysteine–NaOH procedures. The mentioned samples were earlier analyzed and determined by using a cultivation technique as a gold-standard detection method by incubation 250μL of Mycobacterium in the Lowenstein–Jensen media at 37°C in humid atmosphere containing 5% CO2.28
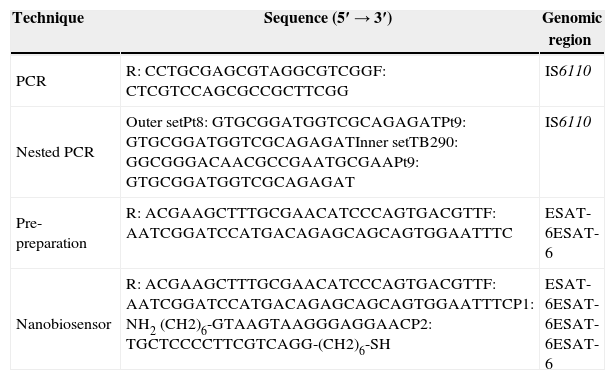
Primers and probesIn the PCR-based-detection phases, the primer sets were ordered based on an insertion sequence of the IS6110 gene region (Table 1).29,30
Characteristics of DNA oligonucleotide primers and probes utilized for detection of MTBC by PCR, nested PCR and nanobiosensor.
| Technique | Sequence (5′→3′) | Genomic region |
|---|---|---|
| PCR | R: CCTGCGAGCGTAGGCGTCGGF: CTCGTCCAGCGCCGCTTCGG | IS6110 |
| Nested PCR | Outer setPt8: GTGCGGATGGTCGCAGAGATPt9: GTGCGGATGGTCGCAGAGATInner setTB290: GGCGGGACAACGCCGAATGCGAAPt9: GTGCGGATGGTCGCAGAGAT | IS6110 |
| Pre-preparation | R: ACGAAGCTTTGCGAACATCCCAGTGACGTTF: AATCGGATCCATGACAGAGCAGCAGTGGAATTTC | ESAT-6ESAT-6 |
| Nanobiosensor | R: ACGAAGCTTTGCGAACATCCCAGTGACGTTF: AATCGGATCCATGACAGAGCAGCAGTGGAATTTCP1: NH2 (CH2)6-GTAAGTAAGGGAGGAACP2: TGCTCCCCTTCGTCAGG-(CH2)6-SH | ESAT-6ESAT-6ESAT-6ESAT-6 |
In the nano-based detection phase, two different oligonucleotide probes were used based on the conserved genomic regions of ESAT-616 to detect MTBC and differentiate between BCG and other Mycobacterium species simultaneously (Table 1). The 5′ end of the first oligonucleotide probe (P1) was linked to QDs by NH2 and the 3′ end of the second oligonucleotide probe (P2) was linked to AuNPs by SH to facilitate the hybridization process. The probes were purchased from Invitrogen (Shanghai Invitrogen Biotechnique Co).
DNA detection by PCR and nested PCR assaysAccording to a DNA extraction technique described elsewhere,31 the chromosomal DNA was extracted utilizing proteinase K and phenol:chloroform, and was subsequently precipitated by using isopropanol and ethanol. To detect MTBC DNA, the PCR and nested PCR assays were performed by utilizing BioRad thermocycler (BioRad, CA, USA) based on the protocols described by Eisenach et al.32 and Wilson et al.33 To examine the existence and size of the amplified fragments, 2% agarose gel and the Gene Ruler™ 50bp DNA Ladder (Fermentas) were used. Visualization of agarose gel was done by ethidium bromide and gels were photographed with UVP Bio Doc-ItTM system CCD camera (UVP Inc., Upland, USA). Moreover, to determine the detection limits of the used methods, different dilutions of a known chromosomal DNA stock were used.
Synthesis of AuNPsThe AuNPs were synthesized through the citrate reduction method by adding trisodium citrate solution to 170mgL−1 HAuC14 under stirring and temperature condition. After a color shift in solution from yellow to red, the stirring and heating were stopped and the solution was stored at 4°C.24 Afterwards, the synthesized AuNPs were characterized by transmission electron microscope (TEM) (Hitachi H-7100) and particles diameter size were determined using UTHSCSA Image Tool (University of Texas).
Synthesis of CdTe QDsThe NaHTe solution was prepared by adding 2mM of NaBH4 and tellurium powder in 50mL of distilled water. To prepare CdTe QDs, 10mM of CdC12 and 25mM of TGA were dissolved in 250mL distilled water under stirring and the pH was adjusted to 11 by using NaOH solution. Subsequently, the NaHTe solution was added to the solution under N2 protection under stirring for 25min. Finally, this mixture was heated to boil at 100°C for 2h.34 Then, the synthesized AuNPs were characterized by TEM (Hitachi H-7100) and particles diameter size were determined using UTHSCSA Image Tool (University of Texas).
Conjugation of the first oligonucleotide (P1) on the CdTe QDs surfaceConjugation of the first probe on the surface of CdTe QDs was carried out by mixing 1mL of CdTe QDs, 20μg of the P1 and 50μL of 1-ethyl-3-(dimethylaminopropyl) carbodiimide hydrochloride (EDC). The solution was mixed in 50mM dipotassium phosphate buffer solution (pH=6) at room temperature.23
Assembling of the second oligonucleotide (P2) on the AuNPs surfaceTo prepare the self-assembly of the probes onto the AuNPs surface, 10mL of AuNPs solution and 20μg of the P2 were mixed at room temperature for about 10h. Afterwards, the solution was added into a dipotassium phosphate buffer solution (pH=6.0). To purify the AuNPs-probe, centrifugation was performed at 18,000rcf for 25min and the pellet was re-suspended in dipotassium phosphate buffer solution.23
Pre-preparation of clinical sputum specimens for biosensor procedureThe clinical sputum samples were first used for PCR amplification of ESAT-6 gene (Table 1).
The PCR was performed by utilizing BioRad thermocycler (BioRad, CA, USA) based on the protocols described by Eisenach et al.32 Subsequently, PCR products were analyzed by sandwich-form FRET-based biosensor.
Sandwich-form FRET-based biosensorTo perform the sandwich-form FRET-based biosensor assay, 10μL of QDs/P1 solution, 10μL of AuNPs/P2 solution and 10μL of PCR product were mixed in a tube. Subsequently, denaturation and annealing of samples with the immobilized oligonucleotides were carried out at 94°C for two min and at 65–68°C for two min, respectively, using a BioRad thermocycler (BioRad, CA, USA). Then, the fluorescence intention spectra were recorded by using a spectrophotometer. Baseline changes estimated by subtracting the second run from the first run and the threshold for negative sample was estimated at 8.2±3.
Fluorescence procedureThe fluorescence spectra were monitored by using a PD-3000UV ultraviolet–visible spectrophotometer (Appel, Japan). The excitation wavelength (excitation wavelength of QDs) was set at 370nm and the emission spectra were probed between 400 and 680nm as the AuNP's (quencher) emission was located in the range of 570–650nm. The excitation and emission bandwidth of 5nm was used.
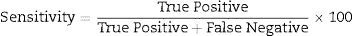
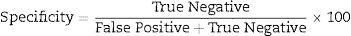
Data analysisData analysis was performed using the SAS 6.12 (SAS Institute, Cary, NC), and diagnostic sensitivity and specificity were determined using usual formula.
The other statistical parameters were calculated using an online clinical calculator available at http://www.vassarstats.net/clin1.html.
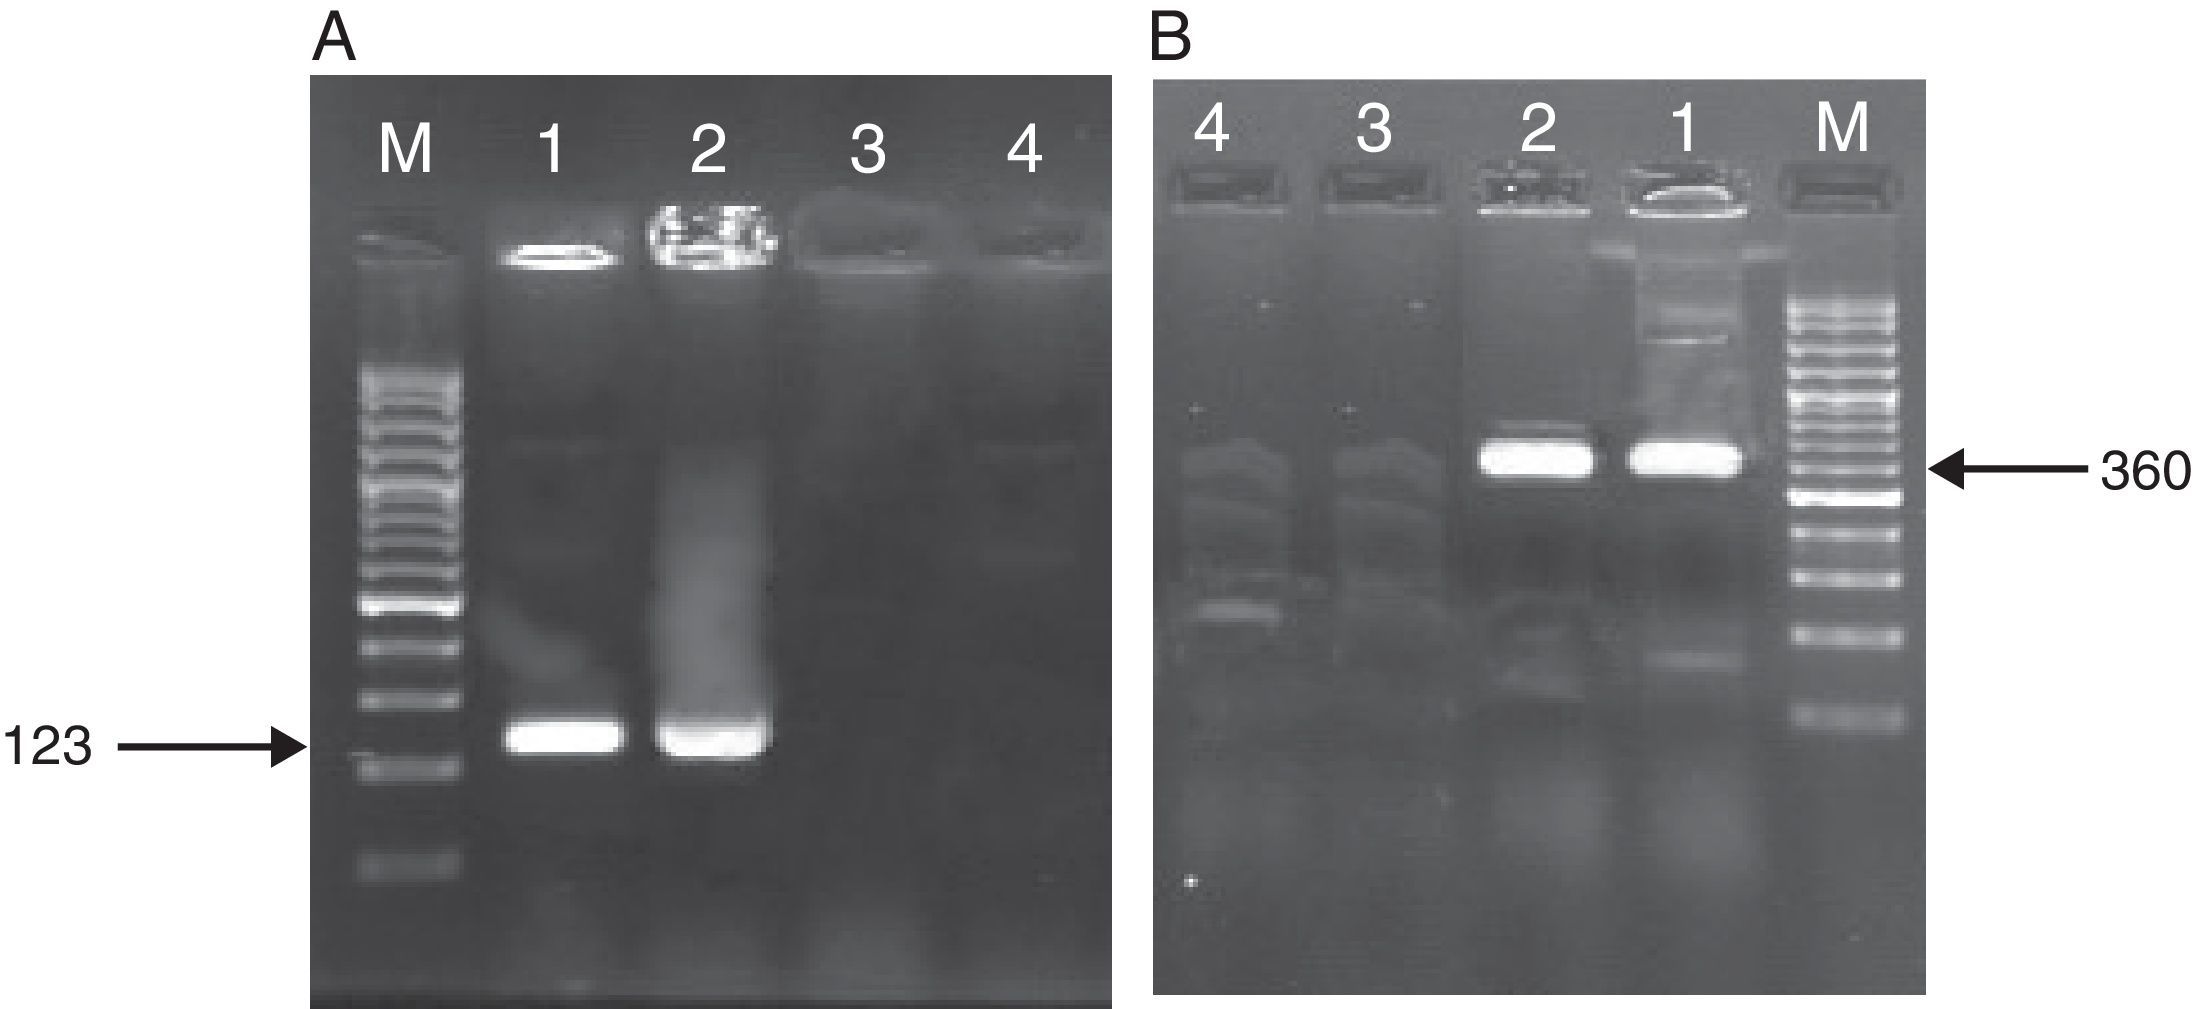
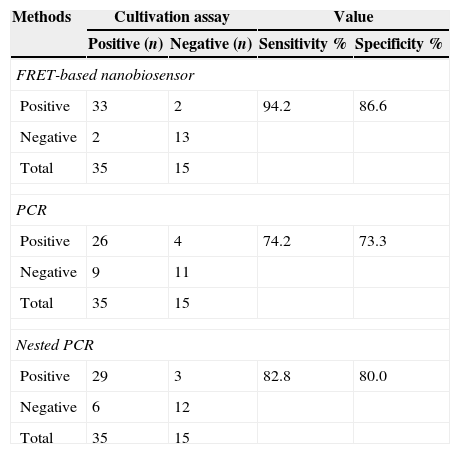
ResultsAs mentioned earlier, cultivation technique was considered the gold-standard detection method in order to compare the other techniques used, i.e. PCR, nested PCR and the sandwich-form FRET-based biosensor. In presence of M. tuberculosis infection in the sample, PCR and nested PCR products of about 123bp and 360bp were observed using IS6110 primer sets (Fig. 2), and 60% (30/50) and 64% (32/50) of the specimens were found positive, respectively. On the other hand, out of the 50 samples tested by the sandwich-form FRET-based biosensor, 70% (35/50) were found positive. Interestingly, out of those 35 positive samples by the FRET-based biosensor, only 33 (94.2%) were culture-positive. Thus, two positive samples by FRET-based biosensor assay were reported negative by the culture-based method. Furthermore, out of the 35 positive samples, only 27 (77.1%) and 30 (85.7%) were detected by PCR and nested PCR techniques, respectively.
 PCR products M: Gene Ruler™ 50bp DNA Ladder, 1: positive control sample, 2: clinical positive sample, 3: negative control sample, 4: clinical negative sample. (B) Nested PCR products (second round) M: Gene Ruler™ 50bp DNA Ladder, 1: clinical positive sample, 2: positive control sample, 3: negative control sample, 4: clinical negative sample.")
Amplified products of MTBC by PCR and nested PCR methods. (A) PCR products M: Gene Ruler™ 50bp DNA Ladder, 1: positive control sample, 2: clinical positive sample, 3: negative control sample, 4: clinical negative sample. (B) Nested PCR products (second round) M: Gene Ruler™ 50bp DNA Ladder, 1: clinical positive sample, 2: positive control sample, 3: negative control sample, 4: clinical negative sample.
Therefore, the overall sensitivity and specificity of the PCR method in relation to the cultivation method for detection of MTBC was 74.2% (95% CI 56.4–86.8) and 73.3% (95% CI 44.8–91.0), respectively (Table 2). Besides, sensitivity and specificity of the nested PCR method in relation to the cultivation technique were 82.8% (95% CI 65.7–92.8) and 80% (95% CI 51.3–94.6), respectively (Table 2). The samples were first utilized for PCR amplification of ESAT-6 gene and subsequently PCR products were analyzed by sandwich-form FRET-based biosensor. The results obtained revealed that the sandwich-form FRET-based biosensor versus cultivation demonstrated in detecting Mycobacterium had sensitivity and specificity of 94.2% (95% CI 79.4–99.0) and 86.6% (95% CI 58.3–97.6), respectively (Table 2).
Comparison between FRET-based biosensor, PCR and nested PCR versus culture method for detection of Mycobacterium tuberculosis in 50 sputum clinical samples.
| Methods | Cultivation assay | Value | ||
|---|---|---|---|---|
| Positive (n) | Negative (n) | Sensitivity % | Specificity % | |
| FRET-based nanobiosensor | ||||
| Positive | 33 | 2 | 94.2 | 86.6 |
| Negative | 2 | 13 | ||
| Total | 35 | 15 | ||
| PCR | ||||
| Positive | 26 | 4 | 74.2 | 73.3 |
| Negative | 9 | 11 | ||
| Total | 35 | 15 | ||
| Nested PCR | ||||
| Positive | 29 | 3 | 82.8 | 80.0 |
| Negative | 6 | 12 | ||
| Total | 35 | 15 | ||
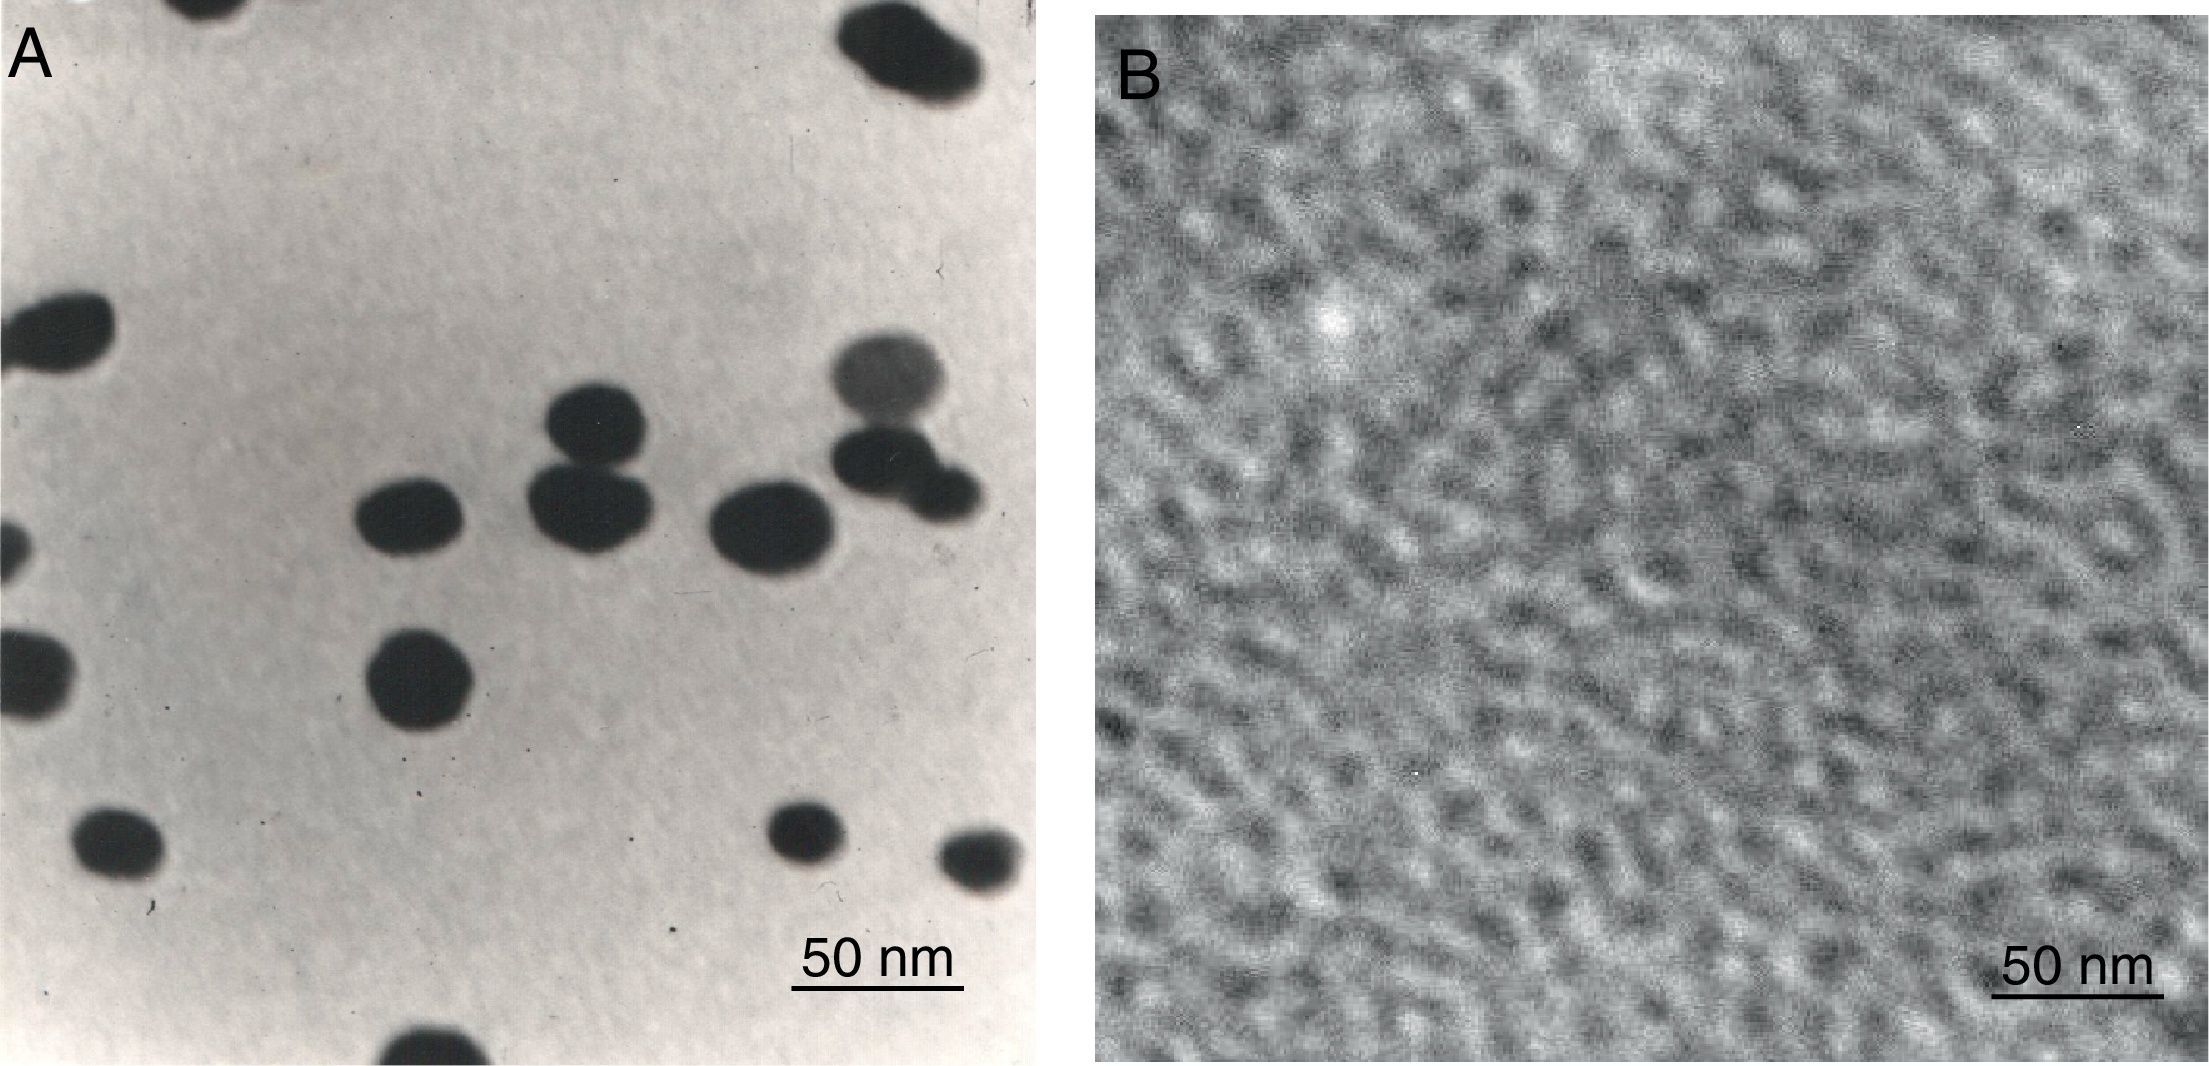
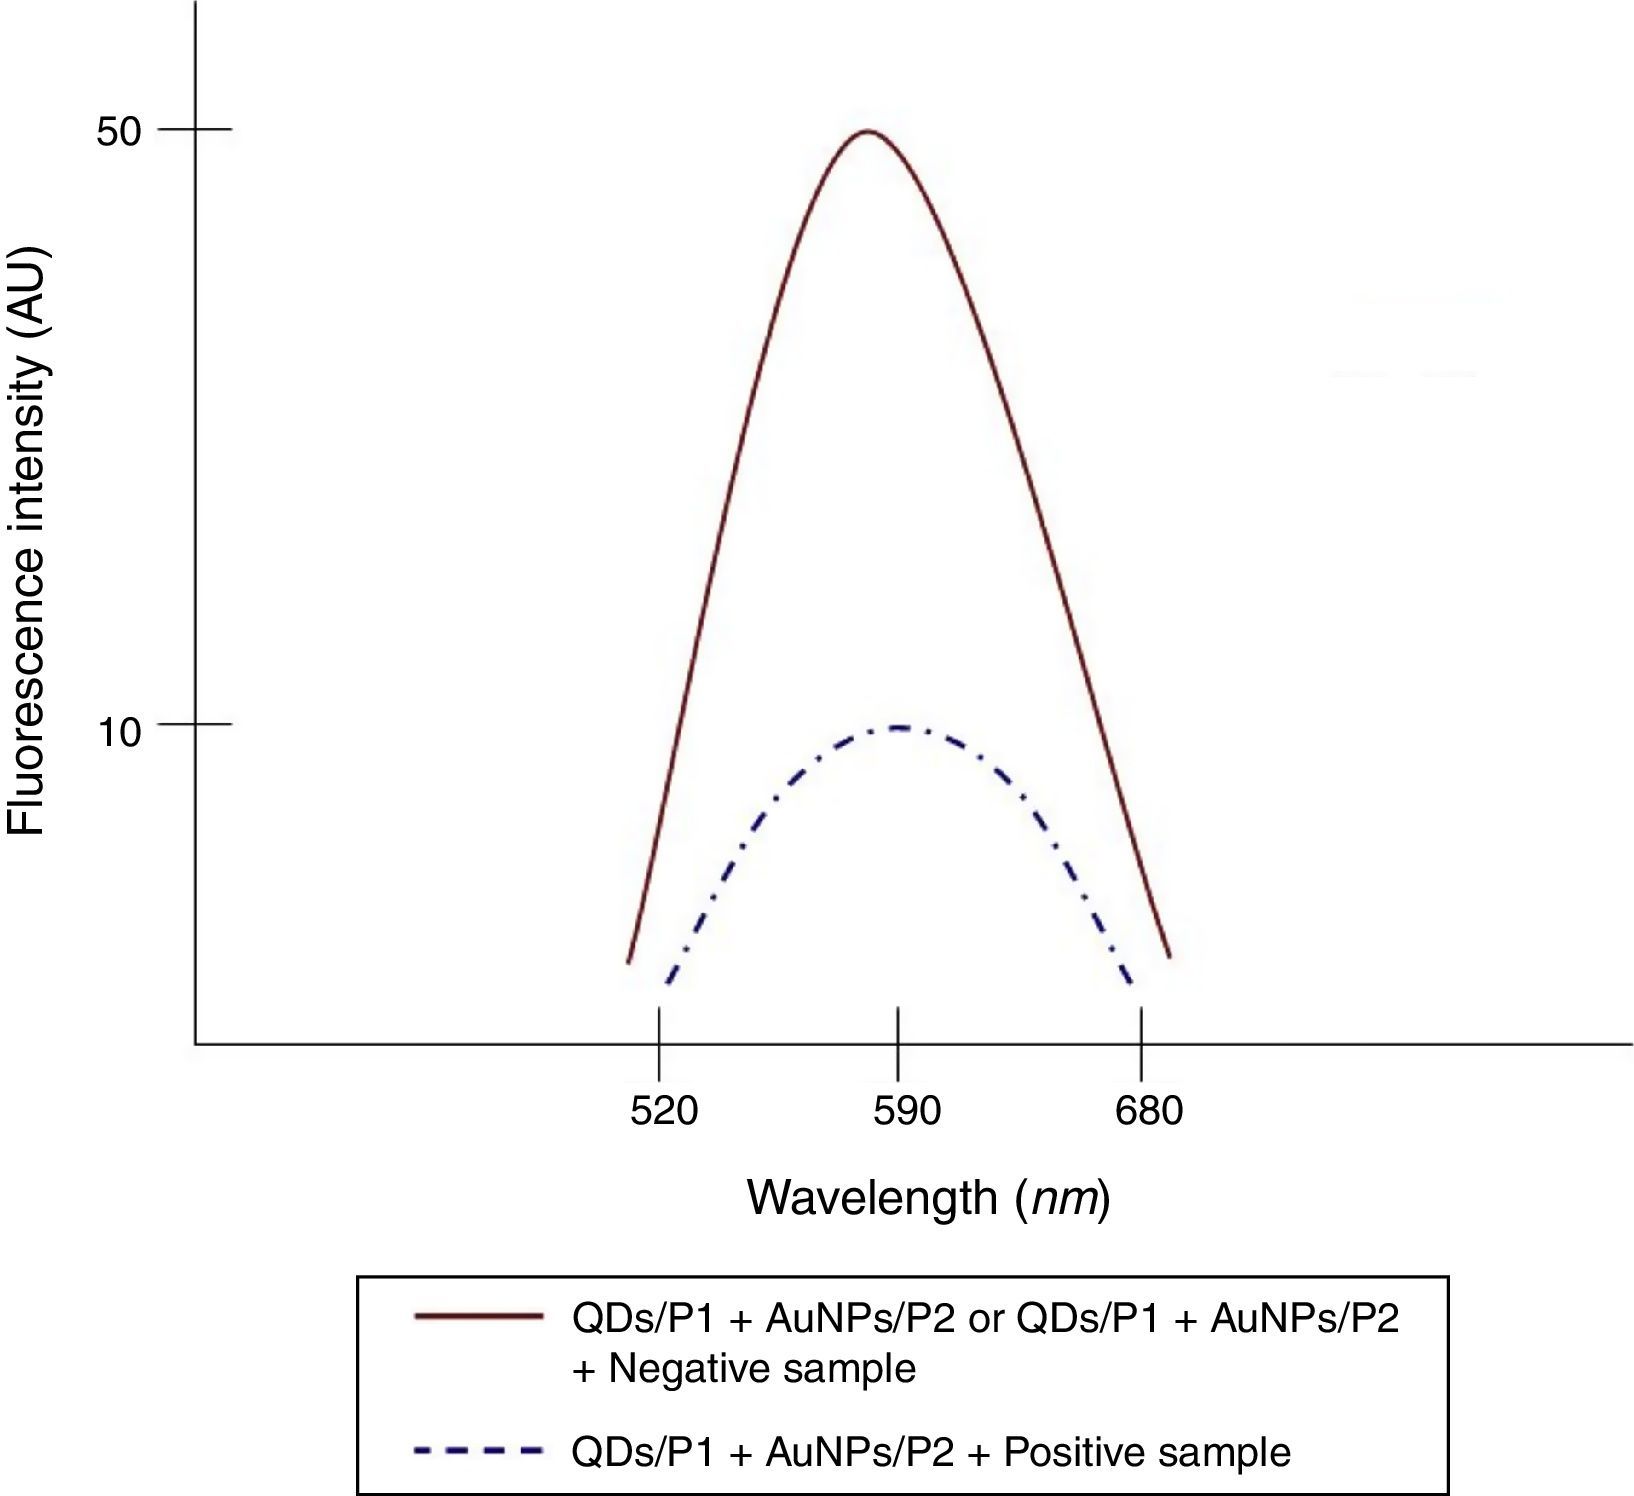
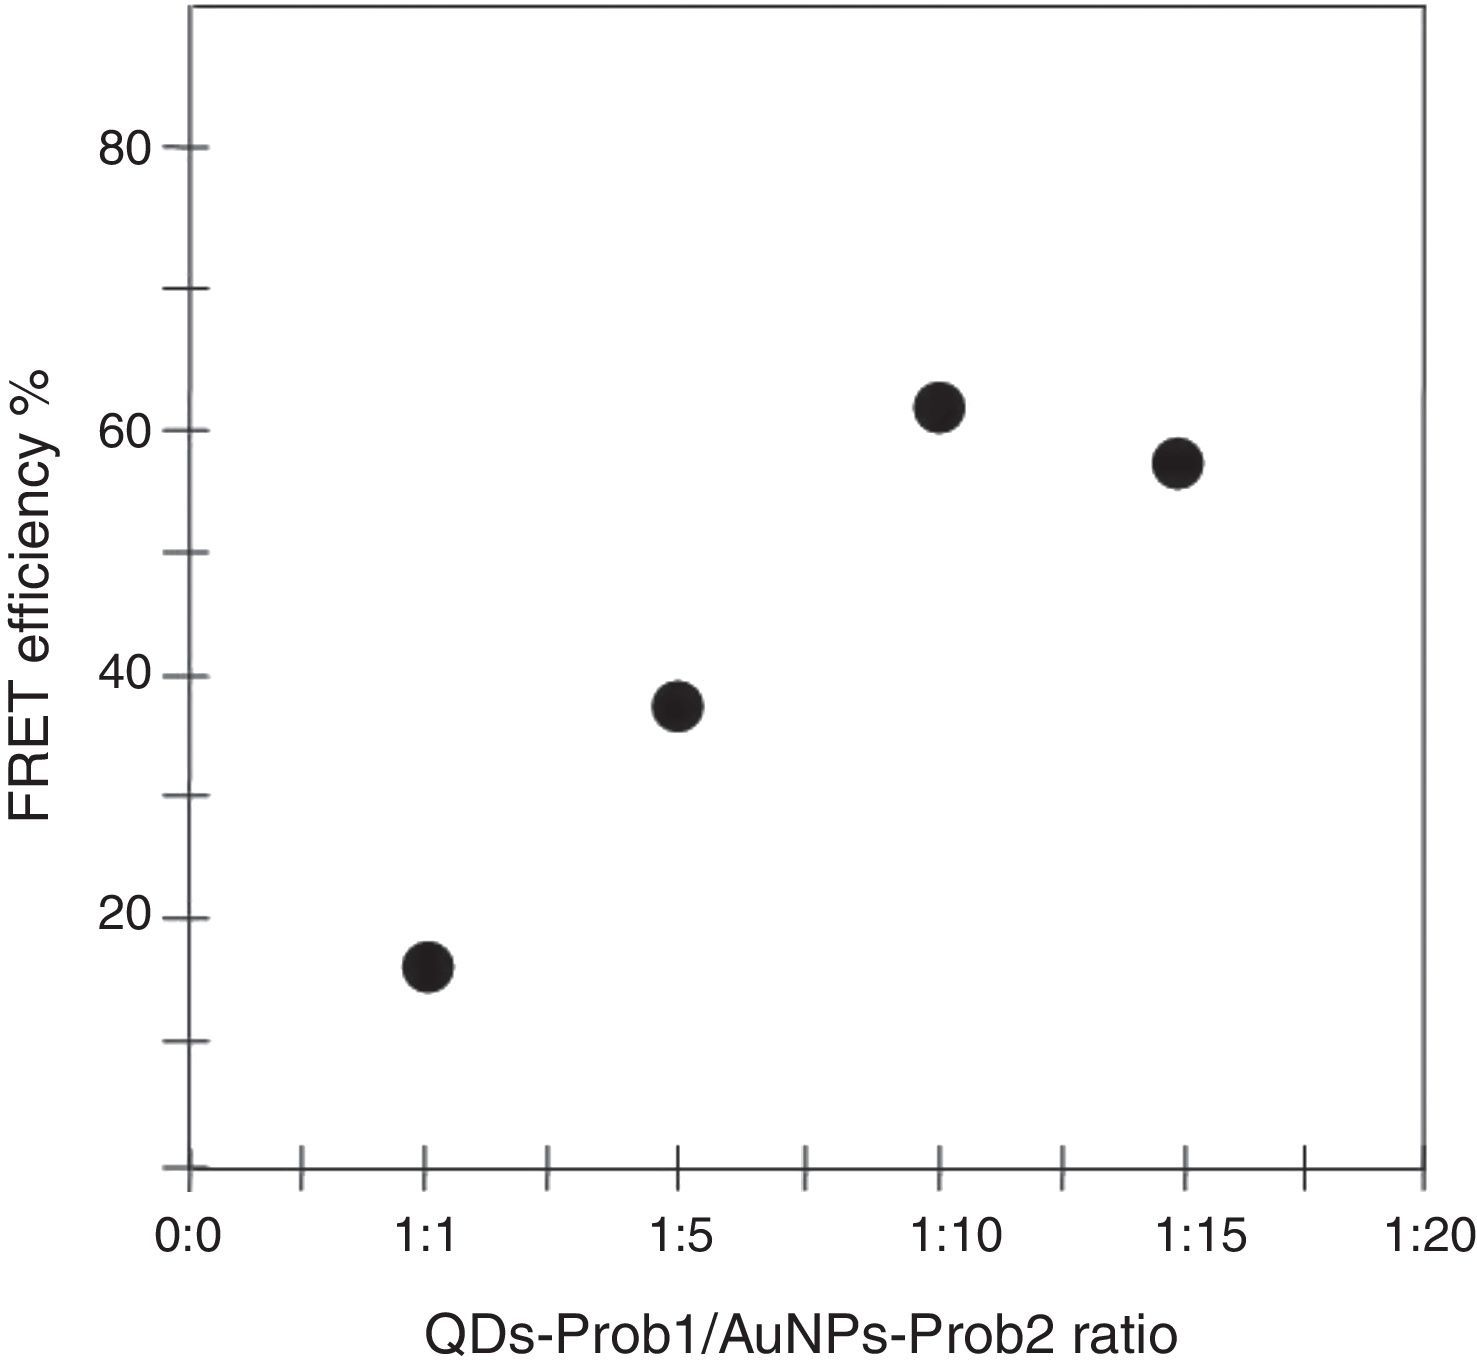
To determine the characteristics of the donors and acceptors in the sandwich-form FRET-based biosensor, the QDs and AuNPs were characterized by using TEM. The TEM image showed that the QD and Au nanoparticles have a spherical morphology and suitable monodispersity (Fig. 3A and B). The QDs and AuNPs particle size were determined at 6nm and 8nm, respectively. From the mechanistic point of view, in the solution containing only the QDs/P1 and AuNPs/P2 (negative control), the fluorescence spectrum was recorded at 50AU, while in presence of Mycobacterium DNA (target molecule), a significant downward shift in the spectrum peaking at 10AU was observed (Fig. 4). The emission spectrum of the QDs and absorption spectrum of AuNPs demonstrated maximum overlap that is critical to obtain FRET phenomena (Fig. 5). The FRET efficiency (E) of the presented system was dependent on molar ratio of AuNPs/P2 to QDs/P1. Increases in the molar ratio of AuNPs/P2 to QDs/P1 leads to an increase in the FRET efficiency and the highest FRET efficiency for developed system was achieved at AuNPs/P2 to QDs/P1 molar ration of 1:10 (Fig. 6)
 and CdTe-QDs (B).")


 to an acceptor (AuNPs) in different molar ratio of AuNPs/P2 to QDs/P1.")
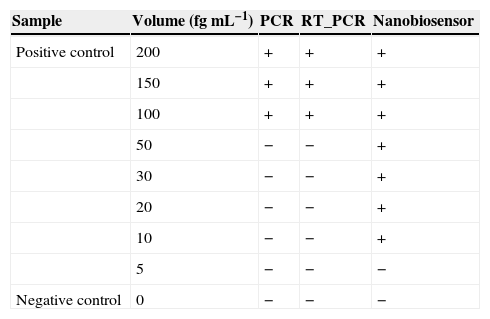
Finally, the detection limit of the PCR and nested PCR methods was measured at 100fg while for the sandwich-form FRET-based biosensor it was 10-fold lower at 10fg (Table 3).
Comparison between PCR, RT-PCR and nanobiosensor detection limits. Presence and absence of specific band in agarose gel in PCR and RT-PCR detection methods were signed positive (+) and negative (−) respectively. In the nanobiosensor technique, observation of downward shift in the fluorometer curve was signed as positive (presence of target) and no shift in the fluorometer curve was signed as negative (absence of target).
| Sample | Volume (fgmL−1) | PCR | RT_PCR | Nanobiosensor |
|---|---|---|---|---|
| Positive control | 200 | + | + | + |
| 150 | + | + | + | |
| 100 | + | + | + | |
| 50 | − | − | + | |
| 30 | − | − | + | |
| 20 | − | − | + | |
| 10 | − | − | + | |
| 5 | − | − | − | |
| Negative control | 0 | − | − | − |
In the oligonucleotide-based detection systems, the important matter concerned is probes specificity against closely related species, and in the case of MTBC detection, the differentiation between BCG vaccinated samples and infected samples. Therefore, utilizing oligonucleotide probes based on conserved region of MTBC, which is deleted in the M. bovis BCG, is important. This point was taken into careful consideration in the present study. Therefore, the conserved genomic regions of ESAT-6 was used as the probe to detect MTBC and differentiate M. bovis BCG from other Mycobacterium species, due to the high existing homology in the ESAT-6 regions of different Mycobacterial species and the absence of this region in BCG strains.
Although, recently WHO recommended Xpert MTB/RIF as a sensitive detection method, it is not available in all countries. Moreover, the widely used methods in the case of clinical TB detection in the region in which the study was conducted are cultivation test and nested PCR; therefore, in this region the newly developed techniques mostly compared with these methods. Due to the insufficient sensitivity and specificity of the PCR-based assays, developing a more sensitive method for the detection of MTBC has been constantly sought. Although, there are different values reported in the published literature, the sensitivity and specificity of PCR assays used for detection of Mycobacterium in the present study were in agreement with the findings of Chawla et al.35 and Ekrami et al.28 In the used clinical samples, four cases were found positive by culture but negative by PCR and nested-PCR, which could be considered as false negative results. These observed false results were attributed to the concentration of target molecules in the clinical samples and to the specificity of utilized primers.
In the case of the nested PCR assay, the sensitivity of 82.8% showed that this technique could not be regarded as an ideal technique to detect MTBC, despite of its specificity to be approximately equal to that of the sandwich-form FRET-based biosensor. The lowest detection limit of Mycobacterium DNA achieved by using PCR and nested PCR techniques was 100fg, which was in agreement with earlier reports.36,37 This value was remarkably higher than that achieved by using the sandwich-form FRET-based biosensor (10fg).
In the sandwich-form FRET-based biosensor, the NH2 linked oligonucleotide (P1) was capable of covalently attaching onto the surface-modified QDs with EDC due to the adsorption tendency of the carboxyl group of EDC and the NH2 linked to the P1.38 This conjugate showed maximum fluorescence radiation at 548nm. Second oligonucleotide (P2) could easily self-assemble on AuNPs due to the attraction of SH linked to the P2 and surface of AuNPs.39 Two samples that were positive by culture and negative by nanosensor showed autofluorescent signals during examination. This problem has been previously reported by Ekrami et al.28 Probably, there is a specific problem when clinical samples are tested. Generally, observed interface by autofluorescence can be attributed to natural factors induced by some reagents in clinical samples.28
The TEM image confirmed that the synthesized QD and Au nanoparticles were appropriate for the nanobiosensor designed (Fig. 3). The emission and absorption spectra of CdTe-QDs and AuNPs significantly overlap at 530nm; therefore, CdTe-QDs and AuNPs could be used successfully as a suitable donor and acceptor pair (Fig. 5). To find out the optimum FRET signal and maximum FRET efficiency, different molar ratios of AuNPs/P2 to QDs/P1 were investigated. Optimum molar ratio of AuNPs/P2 to QDs/P1 was achieved at 1:10 in which FRET efficiency was about 60% (Fig. 6). At higher molar ratios, many oligonucleotide probes immobilized in the surface of AuNPs would remain unhybridized and the FRET efficiency decreased enormously. While, at the lower molar ratio, decrease in the amounts of AuNPs leads to insufficient energy transfer from QDs near AuNPs molecules and subsequently caused a reduction in the FRET signal (Fig. 6). More specifically, the fluorescence spectrum was 50AU for the solution containing QDs/P1 and AuNPs/P2, but in the presence of the target a downward shift to 10AU in the emission spectrum was recorded (Fig. 4). The observed decrease in the fluorescence intensity in the solution containing the targets indicated that FRET process occurred in the QDs/P1-target-AuNPs/P2 complex system. In fact, the AuNPs/P2 moiety in the presence of the target, optically quenched the QDs/P1 moiety, based on the Forster dipole–dipole interaction form.27,40 In other words, presence of the target molecules turned the AuNPs/P2 into a fluorescence acceptor close enough to the QDs/P1 resulting in a fivefold FRET signal (Fig. 1). This principle led to a downward shift of the fluorometer curve in comparison with the curve originally obtained for the solution without any target DNA.
To the best of our knowledge, there has been no published reports on combining QDs and AuNPs to detect bacterial targets, although some researchers have developed techniques by using QDs and AuNPs separately.41–43 For instance, Soo et al.42 introduced an AuNPs cross-linking approach to detect MTBC. More specifically, the AuNPs were functionalized with thiol modified specific probes. In the presence of target DNA, AuNPs hybridized to the target resulting in aggregation and decrease in absorbance of the solution. The absorbance decreases were accompanied by a shift in solution color from red to reddish purple. On the other hand, in the absence of target DNA, the color and absorbance of the solution were not altered. This assay demonstrated the detection limit of as low as 0.5pmol of target.42
In another study, Gazouli et al.43 developed a new technique combining QDs with magnetic beads (MBs) to detect M. tuberculosis and M. avium subsp. Paratuberculosis by using DNA extracted from bronchoalveolar lavage specimens. In this technique, two biotinylated oligonucleotide probes were immobilized on the QDs and MBs surface to form a sandwich like hybridization system. In the absence of target, no fluorescence signal was monitored while in the presence of target DNA, red fluorescence color was observed. The detection limit achieved in this assay was reported at 12.5ng.43
The developed sandwich-form FRET-based biosensor requires small amount of sample; therefore, it could be an appropriate detection technique where limited volumes of samples are available. Moreover, the newly developed biosensor in comparison with the cultivation method showed high sensitivity and specificity. In addition, the developed FRET-based biosensor presented a detection limit of 10fg which was remarkably lower than the 100fg of PCR and nested PCR. The cost of sandwich-form FRET-based biosensor developed in the present study was estimated to be slightly more than the PCR-based techniques; but due to the speed and accuracy of the FRET-based nanobiosensor, its large-scale application would be more cost-effective.
Conflicts of interestThe authors declare no conflicts of interest.
