

Use of CCR5 antagonists requires previous viral tropism determination. The available methods have high cost, are time-consuming, or require highly trained personnel, and sophisticated equipment. We compared a flow cytometry-based tropism assay with geno2pheno method to determine HIV-1 tropism in AIDS patients, in Bahia, Brazil. We tested peripheral blood mononuclear cells of 102 AIDS patients under antiretroviral therapy by using a cytometry-based tropism assay and geno2pheno assay. Cellular membrane receptors were identified by using CXCR4, CCR5 and CD4 monoclonal antibodies, while detection of cytoplasmic mRNAs for gag and pol HIV regions was achieved by using a labeled probe. Genotypic identification of X4 and R5 tropic viruses was attempted by geno2pheno algorithm. There was a high degree of concordance between cytometry-based tropism assay and geno2pheno algorithm in determination of HIV-1 tropism. Cytometry-based tropism assay demonstrated higher sensitivity and specificity in comparison to geno2pheno, which was used as a gold-standard. One sample could not be amplified by geno2pheno method, but was classified as duotropic by cytometry-based tropism assay. We did not find any association between CD4+ count or plasma HIV-1 RNA viral load and tropism results. The overall performances of cytometry-based tropism assay and geno2pheno assay were almost identical in determination of HIV-1 tropism.
To enter the host cells, HIV-1 requires an initial attachment to cells membrane's CD4 receptor, which leads to an interaction between the viral envelope (gp120) and one of the cellular coreceptors: CCR5 or CXCR4.1,2 This step is essential to enable the fusion of viral envelope and host cell membrane, and to allow the introduction of viral genome into cell cytoplasm.3 It was demonstrated that CCR5-tropic viruses predominate during the initial phases of infection, whereas CXCR4-binding viruses usually emerge in a later phase, and are associated with a faster CD4+ T-cell decline and progression to AIDS.4 Most HIV variants isolated from drug-naive, chronically infected individuals, use CCR5 along with CD4 to enter T cells (R5 tropic viruses). On the other hand, viruses able to use CXCR4 coreceptors (X4-tropic) tend to emerge later in the course of HIV infection, in comparison with R5 strains, and are recognized in nearly half of patients with advanced disease stages. Coreceptor switch may occur overtime in patients under antiretroviral therapy.5
CCR5 antagonists are a relatively new class of drugs that block HIV entry into target cells. These drugs bind to a hydrophobic pocket formed by the transmembrane helices of CCR5, and induce conformational changes in the extracellular loops (ECLs) of the receptor. Since they are active only against R5 viruses, it is necessary to determine the viral tropism previously to the use of CCR5 antagonists in HIV treatment.6–12
Different genotypic and phenotypic tools have been used to define HIV tropism.13,14 The viral tropism has been determined by using phenotypic methods (like Monogram's Trofile), by sequencing the V3 loop of HIV envelope, and by flow cytometry-based assays.15–17 Despite some recent improvements, genotypic algorithms are still restricted to referral laboratories, and their predictive values have limitations.18–20 Recently, a new algorithm (geno2pheno) showed a good correlation with phenotypic methods.21 Another genotypic approach is ultra-deep sequencing, but it is expensive, requires sophisticated equipment, and is not applicable to daily clinical practice.22
Currently, the most used tropism assays are phenotypic- (“Trofile”) or genotyping-based tests (geno2pheno). Both tests share some practical limitations, such as high cost, prolonged time to obtain a confirmed result, availability, considerable proportion of “nonreportable” results, the requirement of samples with a detectable level of HIV RNA copies/ml, and limited access in developing countries.23 Flow cytometry tropism assay (FCTA) was initially developed as a commercially available method (ViroTect Tropism Assay, Invirion Diagnostics, USA), based on fluorescence-activated cell sorting, with a turnaround time of 3h (Invirion Diagnostics, 2007), and a significantly lower cost, in comparison with the above described methods.
In the present study, we compared the performance of an in-house flow cytometry-based assay, with geno2pheno assay for determination of viral tropism in peripheral blood mononuclear cells (PBMC) of HIV-infected patients.
Material and methodsWe evaluated viral tropism of HIV strains in PBMC of 102 consecutive HIV-1-infected patients, who attended the AIDS outpatient clinic of Hospital Universitário Professor Edgard Santos, Federal University of Bahia, Brazil. Patients assigned to routine evaluation of HIV viral load, and CD4/CD8+ cell count were invited to enter the study. The institutional ethics review committee approved the study, and patients were recruited after signing a written informed consent.
Flow cytometry tropism assay procedureDetermination of HIV-1 tropism by FCTA was performed by mRNA in situ hybridization (FISH), combined with T cell immunophenotyping to define expression of CCR5 and/or CXCR4 coreceptors. A labeled probe detected epitopes of Gag and pol HIV-1 regions.15
Briefly, we fixed and permeabilized PBMC with specific buffers. After washing with PBS, a mRNA probe labeled with 6-FAM fluorophore and an integration buffer were added to cell suspension, and incubated for 2h in warm bath in the dark. The samples were submitted to a new washing step, and monoclonal antibodies to CD4 (labeled with APC), to CXCR4 (PE), and to CCR5 (PerCP) were added, before acquisition and analysis by BD CellQuest software from FACSCalibur, with four fluorimetric parameters.
HIV-1 env genetic sequencingPBMC DNA was extracted by QIAGEN protocol. Amplification of partial HIV envelope (env) gene by nested PCR was performed with 2.5μL of DNA input. Reaction mixture included 10μM of each primer ED5, forward position ATG GGA TCA AAG CCT AAA GCC ATG TG (6557→6582) and ED12, reverse position AGT GCT TCC TGC TGC TCC CAA GAA CCC AAG (7811←7782) with Taq Platinum High Fidelity (Invitrogen) in a final volume reaction of 25μL. Positive and negative controls were included in each run. PCR conditions consisted of 10 cycles 94°C 2min, 94°C 15s, 55°C 30s, 68°C 1min, 25 cycles 94°C 15s, 55°C 30s, 68°C 1min add 5s/cycle, and 68°C 7min; 2.5Ul of PCR products were used in a second PCR (nested) with primers ED31, forward position CCT CAG CCA TTA CAC AGG CCT GTC CAA AG (6817→6845) and ES8, reverse position CAC TTC TCC AAT TGT CCC TCA (7668←7648) with Taq DNA Polymerase (Invitrogen) in a final volume reaction of 25μL.
PCR conditions consisted of 10 cycles 94°C 2min, 94°C 15s, 55°C 30s, 72°C 1min, 25 cycles 94°C 15s, 55°C 30s, 72°C 1min (increasing by 5s in each sequential elongation), with a final elongation period at 72°C 1min, add 5s/cycle. PCR reaction was considered valid when the PCR products and positive control bands were visualized around 700bp at 1.3% agarose gel with SYBR Safe DNA gel staining (Invitrogen, USA) along with controls. Nested PCR products were quantified using low mass ladder (Invitrogen, USA), diluted accordingly (1:10) in water to allow an input of 5–10 nanograms of DNA for rodamine incorporation. Big Dye Kit (Ready Reaction Mix, Applied Biosystems, Foster City, CA) was used with the primers V3O2, forward position 5′ AAT GTC AGY ACA GTA CAA TGT ACA C 3′ (6948→6969), ES7, forward position 5′ CTG TTA AAT GGC AGT CTA GC 3′ (7005→7021), ED33 reverse position 5′ TTA CAG TAG AAA AAT TCC CCT C 3′ (7360←7378) and SQV3, reverse position 5′ GAA AAA TTC CCT TCC ACA ATT AAA 3′ (7350←7370). Cycle sequencing conditions consisted of 25 cycles 96°C 10s, 50°C 5s, 60°C 4min, 8°C infinity. After cycle sequencing, DNA precipitation (using a solution of sodium acetate and ethanol) was followed by denaturation using Hi-Di Formamide at 94°C 4min and resolved at an automated sequencer Genetic Analyzer 3130 XL (Applied Biosystems). Sequences were edited using Sequencer (Biocodes, USA) and submitted to geno2pheno evaluation (Max Planck Institute, Germany) using clonal option.
Statistical parameters were analyzed by SPSS v.17 software. FCTA and geno2pheno results were compared and evaluated by Pearson Chi-square test. Sensitivity, specificity and positive (PPV) and negative (NPV) predictive values were also calculated between the two assays.
ResultsA total of 102 PBMC samples from HIV infected patients were evaluated. Median age was 42 years. The median CD4+ lymphocyte count was 489cells/mm3 (IQR: 305–675), CD8+ was 886cells/mm3 (IQR: 716–1229), and CD3+ was 1529cells/mm3 (IQR: 1187–1946). The mean elapsed time since HIV diagnosis was six years (range 2–6 years). Sixty-six patients presented with undetectable HIV viral load, while 28 had a viral load higher than 1500copies/ml. Eight patients did not have an available viral load measurement in the past 12 months.
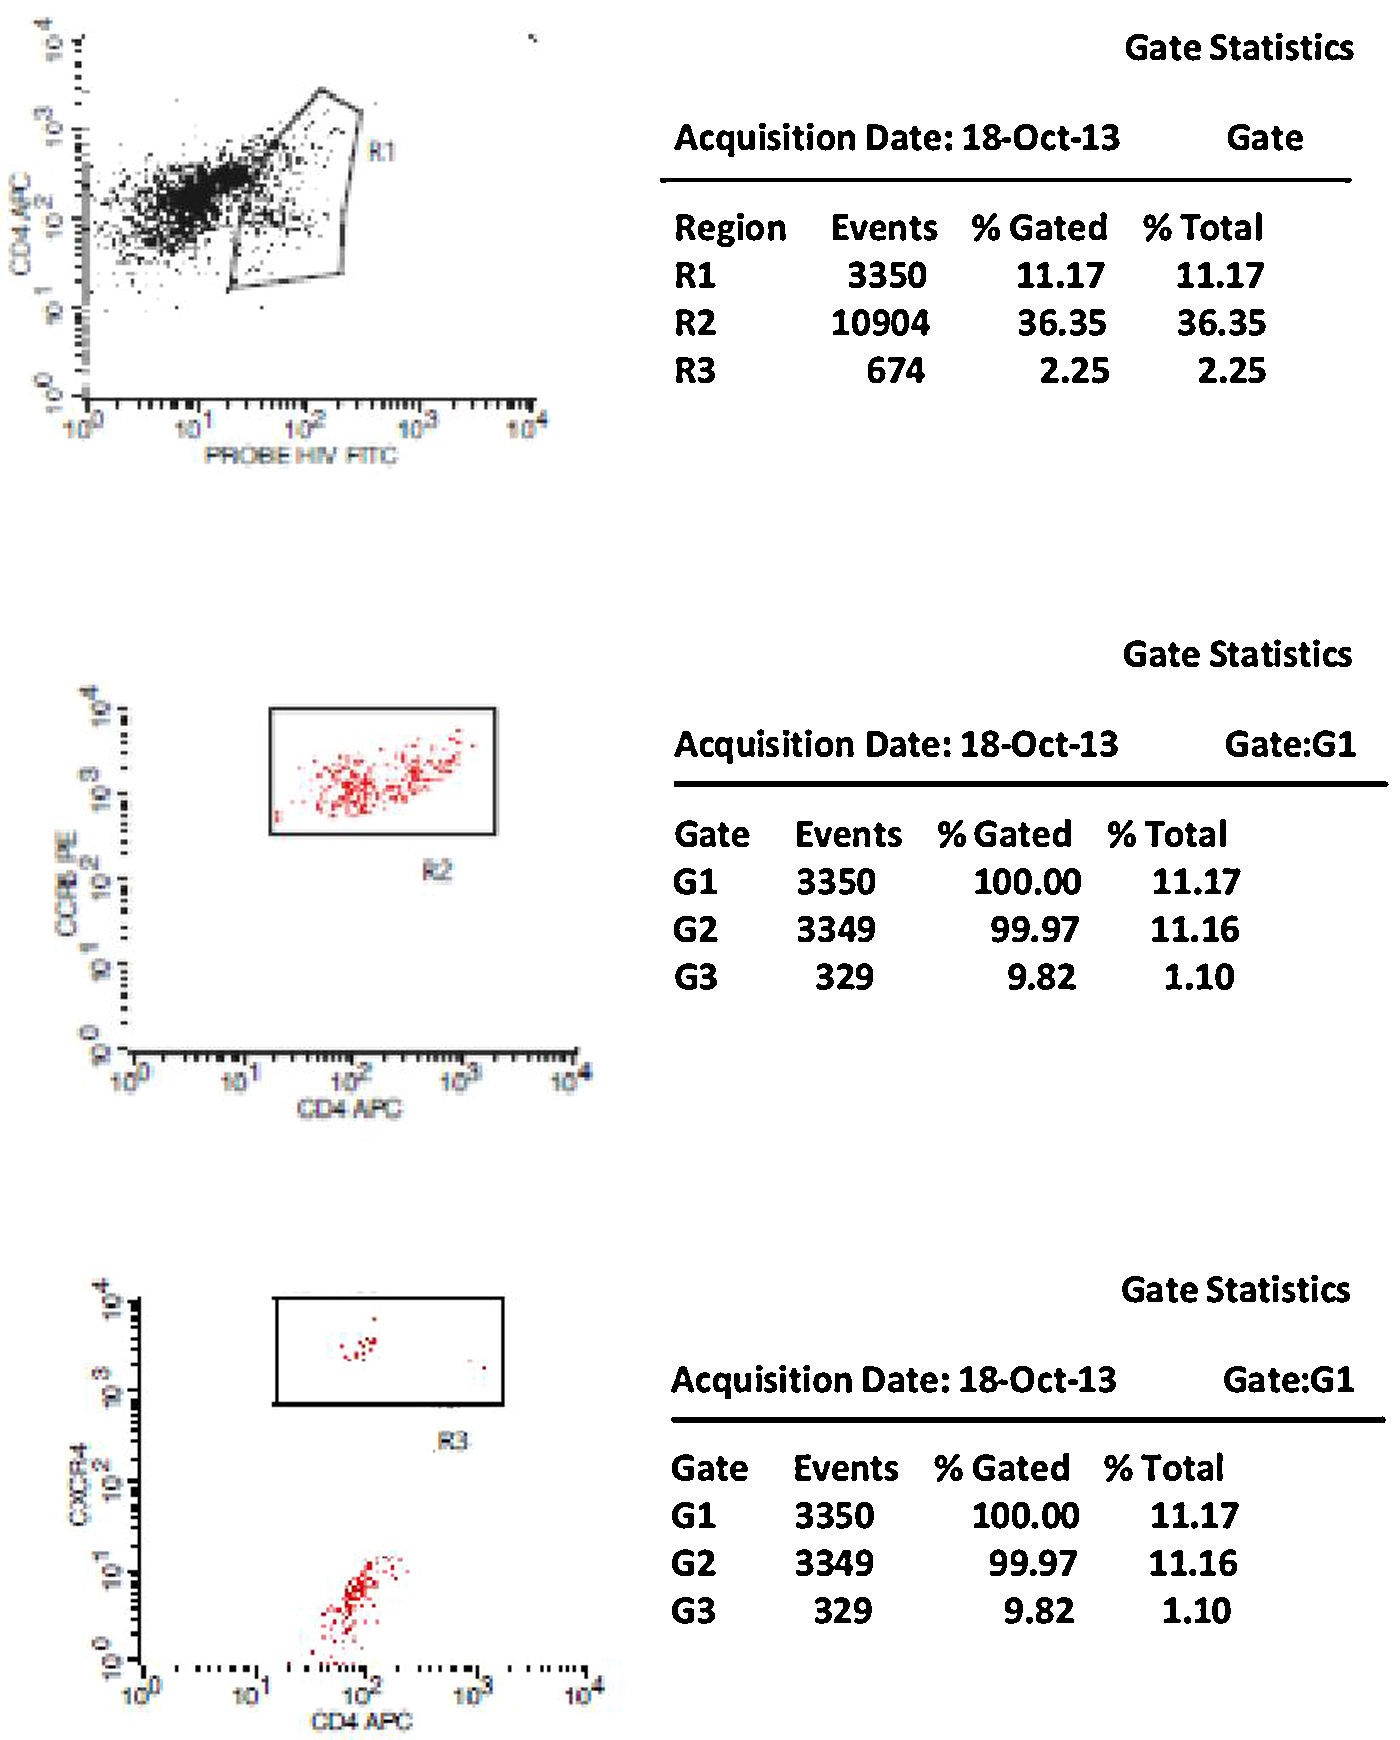
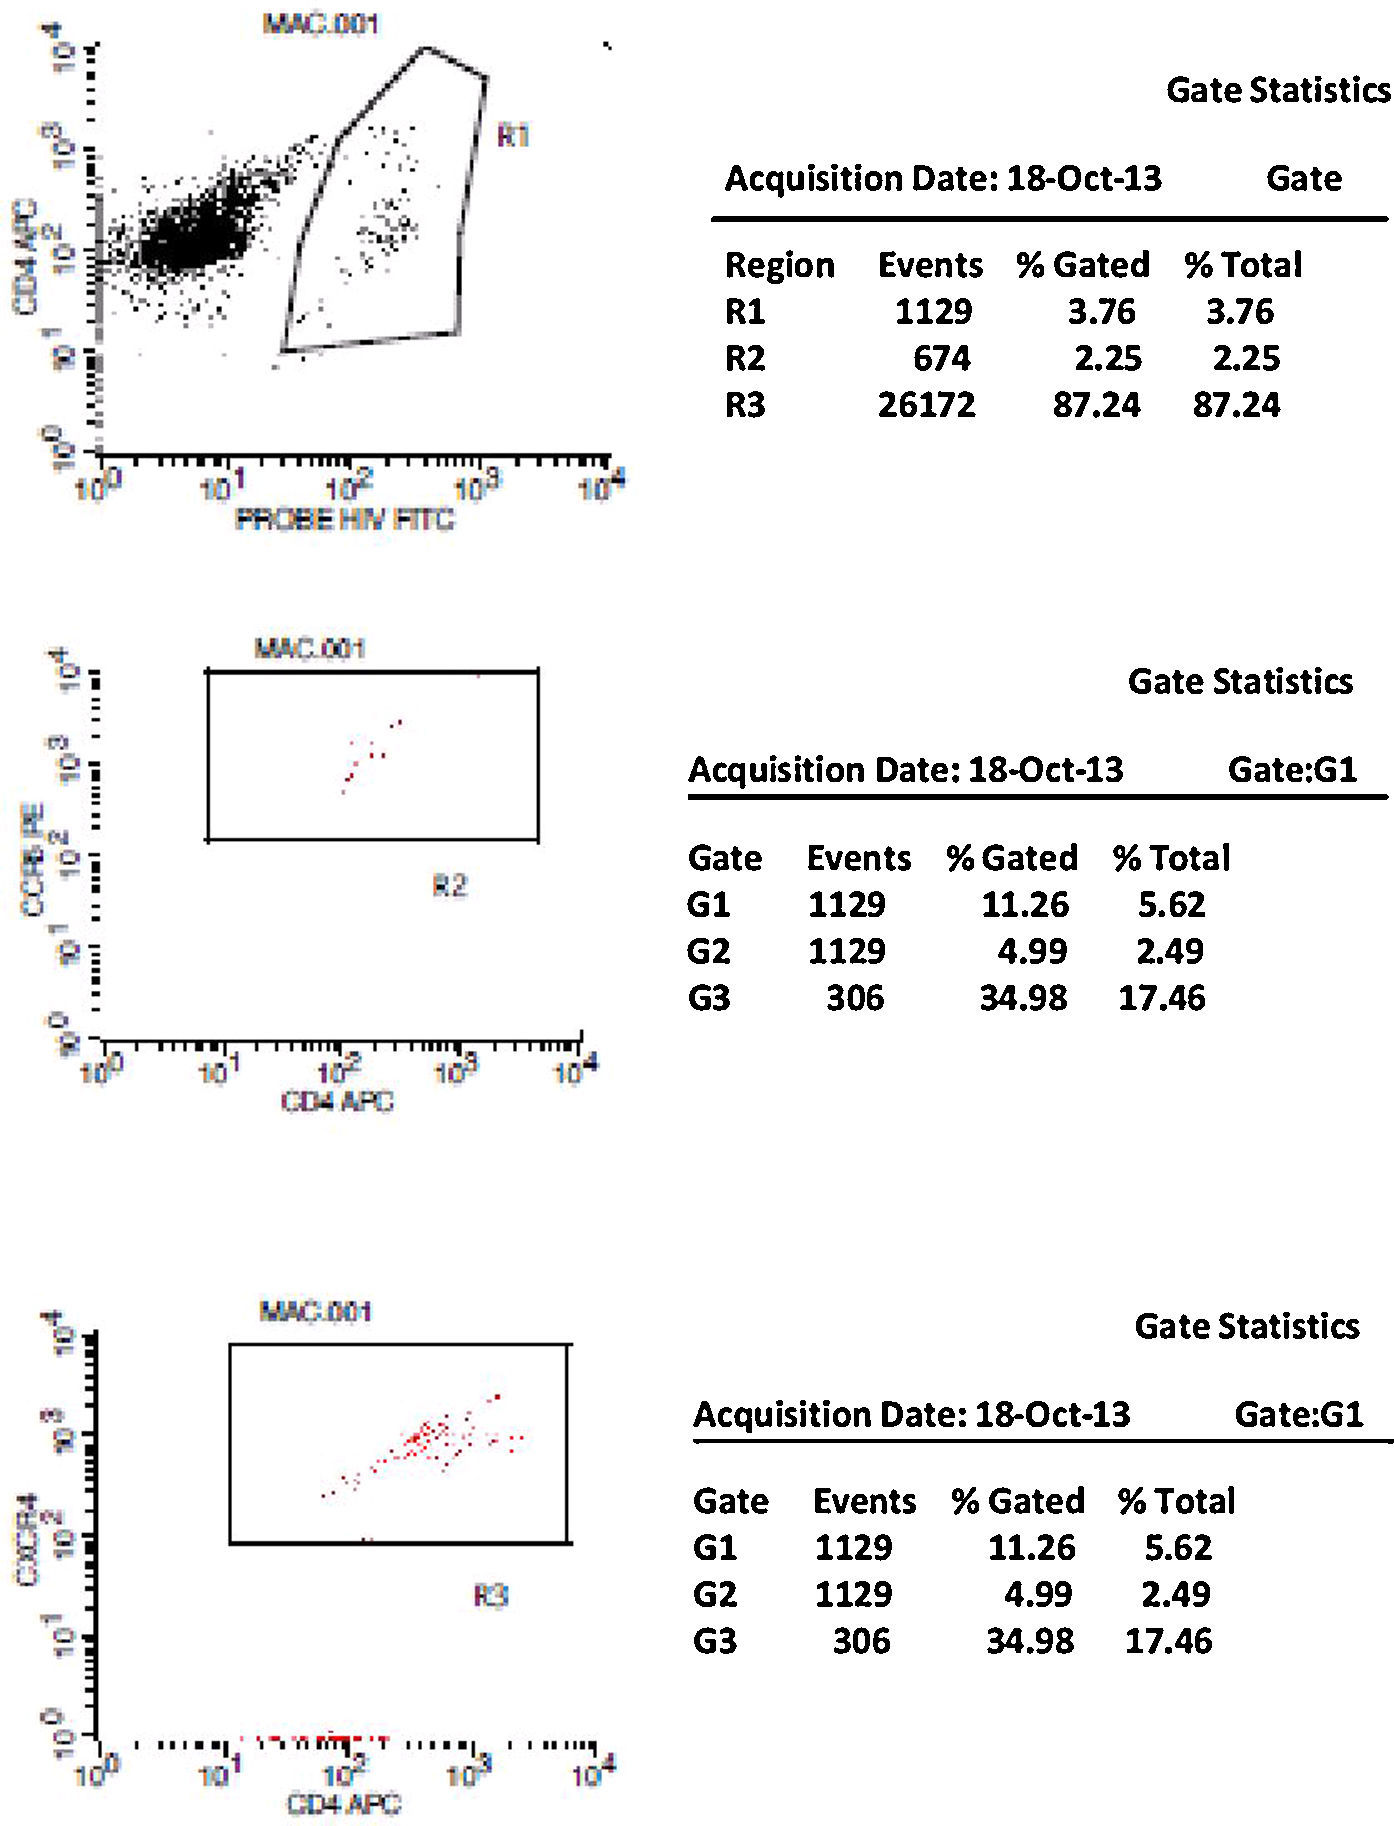
Initially, we used gate strategy Side Scatter versus CD4+ in dot plot FCTA analysis for selection of monocytes and lymphocytes. In the sequence, CD4+CCR5+ and CD4+CXCR4+ positive events were isolated in two different gates. In each gate CCR5+ was plotted versus CXCR4+. A gate was selected for CCR5+CXCR4− cells, and analyzed to detect HIV-1 probe versus CD4+ cells in other plot. The same procedure was performed to identify CCR5−CXCR4+ cells, as shown in Figs. 1 and 2.

Negative control. This figure shows the results of FCTA determination for seronegative individuals. In the first plot lymphocytes and monocytes populations are identified by Forward Scatter and CD4+ gate strategy. In second plot, only CD4+ populations are viewed, with no cell labeled by HIV probe.
 and CXCR4 (B) tropism, we first identified CD4+ cells, HIV-infected cells (monocytes and lymphocytes) in R1, by using HIV Probe versus CD4 dot plot. The selected gate to infected cells, was used to define HIV tropism, by using CD4+ versus CCR5 and CD4+ versus CXCR4 in dot plots for final analysis.")
CCR5 HIV tropism result model. To define CCR5 (A) and CXCR4 (B) tropism, we first identified CD4+ cells, HIV-infected cells (monocytes and lymphocytes) in R1, by using HIV Probe versus CD4 dot plot. The selected gate to infected cells, was used to define HIV tropism, by using CD4+ versus CCR5 and CD4+ versus CXCR4 in dot plots for final analysis.
Figs. 1 and 2 show the results of tropism determination for two different patients: one with CCR5 tropism (A1–A6) and the second with CXCR4 tropism (B1–B6). Initially, SSC versus CD4+ dot plot was used as gate strategies to monocytes and lymphocytes selection. In the first sample (A1–A6) we initially selected the CD4+CXCR4+ cells population (A1). In the sequence, A2 determines the axis position to the positive CXCR4+ population (first quadrant), and A3 demonstrates that there are no cells in the second quadrant (W1), which means a negative result for X4 tropism. When we look at the CCR5+ cells, A4 select the entire CD4+CCR5+ cell population (R2). In A5 we have the definition of axis position to the CCR5+ population (first quadrant), and in A6 we can detect HIV-infected cells in the second quadrant (W2), which give us a definition of R5 tropism (Fig. 3).

To define CXCR4 tropism, in a second patient (B1–B6), the analysis was performed in a similar way. The only difference was that in B3 we found cells in w4 (second quadrant) which indicates a positive result to CXCR4 HIV-1 tropism. No cells are detected in the second quadrant (w5) in B6.
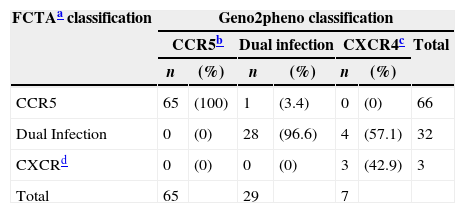
HIV-1 FCTA and geno2pheno tropism results were paired and defined 98% sensitivity, 96% specificity, and 98% positive 92% negative predictive values of FCTA, in comparison to geno2pheno method. Sixty-five patients presented R5 tropism according to both methods; only one patient had discordant results. Three patients presents X4 tropism in both tests and 28 were dual tropic according to the two tests and in four samples the tests had discordant results. Table 1 shows the overall performance of both tests.
HIV-1 tropism classification according to the assay employed.
| FCTAa classification | Geno2pheno classification | ||||||
|---|---|---|---|---|---|---|---|
| CCR5b | Dual infection | CXCR4c | Total | ||||
| n | (%) | n | (%) | n | (%) | ||
| CCR5 | 65 | (100) | 1 | (3.4) | 0 | (0) | 66 |
| Dual Infection | 0 | (0) | 28 | (96.6) | 4 | (57.1) | 32 |
| CXCRd | 0 | (0) | 0 | (0) | 3 | (42.9) | 3 |
| Total | 65 | 29 | 7 | ||||
The overall concordance rate between both tests for identifying R5 virus was 100% (95% CI: 94.4–100%). Thirty-five patients were classified as non-R5 (32 as duotropic/mixed viruses and three as X4) by geno2pheno. All but one sample were equally classified as non-R5 by FCTA: one sample was classified as non-R5 by geno2pheno and as R5 by FCTA. These results correspond to 97.2% specificity (95% CI: 85.8–99.5%) of FCTA using geno2pheno as gold standard. One additional sample could not be amplified in geno2pheno and was classified as duotropic by FCTA.
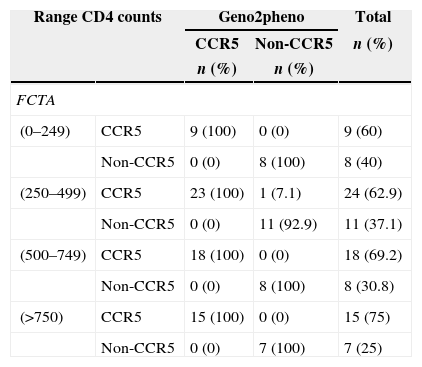
The FCTA performance compared to geno2pheno was consistent regardless of CD4+ cell count level. Table 2 displays the test results of viral tropism for different CD4 strata.
HIV-1 tropism according to CD4+ cell count stratification, and to the type of assay used.
| Range CD4 counts | Geno2pheno | Total | ||
|---|---|---|---|---|
| CCR5 | Non-CCR5 | n (%) | ||
| n (%) | n (%) | |||
| FCTA | ||||
| (0–249) | CCR5 | 9 (100) | 0 (0) | 9 (60) |
| Non-CCR5 | 0 (0) | 8 (100) | 8 (40) | |
| (250–499) | CCR5 | 23 (100) | 1 (7.1) | 24 (62.9) |
| Non-CCR5 | 0 (0) | 11 (92.9) | 11 (37.1) | |
| (500–749) | CCR5 | 18 (100) | 0 (0) | 18 (69.2) |
| Non-CCR5 | 0 (0) | 8 (100) | 8 (30.8) | |
| (>750) | CCR5 | 15 (100) | 0 (0) | 15 (75) |
| Non-CCR5 | 0 (0) | 7 (100) | 7 (25) | |
In the present study, use of FCTA or geno2pheno algorithm for determination of HIV-1 tropism in patients with different strata of viral load and CD4 count provided practically identical results. The discovering of CCR5 antagonists and its use for the treatment of HIV-1 infection has led to development of several HIV-1 tropism tests. A phenotypic test (Trofile) was the first assay created for that purpose. Since coreceptor tropism is a requisite to the use of such drugs, the addition of these tests to clinical practice has allowed health professionals to safely select CCR5 antagonists as active drugs to compose antiretroviral regimens.24
Subsequently, other assays were developed: a Spanish group created a different phenotypic assay (TROCAI), and its results were compared with Trofile. TROCAI provided a reportable result in all patients with viral load >500 HIV-1 RNA copies/ml of plasma, and in 3/6 patients with <500 HIV RNA copies/ml. Patients responding to maraviroc had a 0–0.41% proportion of X4-using virus in supernatant of indicator cells. Hence, it was used a threshold of 0.5% to categorize TROCAI results as R5 (<0.5%) or dual/mixed (>0.5%). The concordance between TROCAI and Trofile (ES) was 22/24 (91.6%). In comparison with the genotypic method it reached 22/26 (84.6%).23
Another test was developed to determine HIV-1 tropism by genotyping, which used duplicate PCR amplification of the region encoding V3 loop. The evaluation of its performance was attempted by comparing with results of the TROFILE assay. The sensitivity of V3 genotyping in predicting CXCR4-using viruses increased from 56.8% (with single PCR) to 68.2%, with duplicate PCR (p=0.13). The concordance between the duplicate PCR approach and Trofile was of 76% for HIV-1 subtype B and 83% for non-B HIV-1 subtypes.25
Results genotypic assays are interpreted by using specific algorithms for definition of viral tropism of a specific sample. In a study that evaluated the performance of genotypic algorithms for predicting HIV tropism, PSSMX4X5 showed the best concordance with ES Trofile (82.6%; 95% CI, 76.7–86.4%). Geno2pheno assay (false-positive rate, 20%) showed the highest sensitivity to predict CXCR4 (76.7%; 95% CI, 61.8–87.5%), with a specificity of 73.6% (95% CI, 68.7–77.2%). Although no significant difference in the accuracy of the bioinformatics tools was detected: 1% and 2.5% with Geno2pheno, respectively, when assessing HIV tropism in samples from drug-naïve patients and in samples originated from treatment-experienced patients.21
In a study conducted by Vilchez et al.,16 a commercially available FCTA kit (ViroTect Tropism Assay, Invirion, USA) was compared with TROFILE. In a total of 288 samples, FCTA provided less inconclusive results (6%) than TROFILE (13%). In addition, it was more likely than standard TROFILE, to detect CXCR4 viruses in that population. Although a recent enhancement of TROFILE increased the sensitivity of the test to detect X4 viruses, the study results indicate that FCTA may be a reliable option for HIV-1 tropism determination.
Geno2pheno methodology for HIV-1 tropism determination became a faster and cheaper alternative to phenotypic tests. The available evidence indicate that geno2pheno provides an efficient way to evaluate viral tropism, and it is the test recommended by the European AIDS Clinical Society (EACS) guidelines.25
According to some studies, CD4 count can be an important predictive factor in determining viral tropism. Among the algorithms, PSSMX4R5 showed the highest concordance rate with ES TROFILE. The best correlation with TROFILE was obtained in patients presenting with CD4+ cell count between 200 and 500cells/mm3. In contrast, the weaker correlations were found in patients with CD4+ cell count lower than 200cells/mm3. In our work, there was no variation in test performance across different strata CD4 cell counts. Of note, there was a higher likelihood of identifying R5 viruses in patients with CD4 cell count between 250 and 499cells/mm3. It is well known that X4 viruses emerge late in the course of HIV-1 infection, and our results are consistent with such contention.
In our study, FCTA presented a performance to define viral tropism comparable to that found by using geno2pheno methodology. FCTA has the advantage of being less time consuming, and has a lower cost than genotypic tests. It is also technically simpler, and requires less sophisticated laboratories than genotypic–based methods. Brazil has a large (over 90 sites), already in-place network of referral laboratories capable of performing flow-cytometry assays for management of HIV-infected patients in public health settings. On the other hand, only of these laboratories are able to perform genotypic tropism tests, and are responsible for receiving samples from all Brazilian states.
Maraviroc, the only CCR5 antagonist approved to clinical use, was recently made available for treating Brazilian HIV-infected patients with previous failure to other drugs/classes. It is expected a significant increase in the number of tropism tests referred to reference laboratories, and there is a concern on their capability to timely respond to such an increasing demand. A simpler, faster, tropism test would be of help in such situation. It makes FCTA a potentially useful tool, with significantly lower costs, and shorter turnaround time. It could be widely used, due to the already existing conditions. Moreover, our results demonstrated that FCTA has a high concordance rate with geno2pheno algorithm in addition to not require nucleic acid amplification. Other advantage is its capacity to define viral tropism even in patients under suppressive therapy, once it uses proviral DNA, and does not depend on detectable HIV-1 RNA in plasma.
In conclusion, FCTA showed an excellent correlation with genotypic assay and could represent a cheaper, faster and easier tool. Its implementation could provide larger access of Brazilian patients to treatment with CCR5 antagonists.
Conflicts of interestThe authors declare no conflicts of interest.
