Rifampicin is a key component of treatment for tuberculosis and its efficacy is determined by the blood levels attained after therapeutic doses. However, there is a high variability of rifampicin blood levels that is related to both the patient and the formulation used. To date, the effect of diabetes mellitus on the plasma levels of rifampicin was low exploited, which could be relevant either by the significant increase of the comorbidity worldwide as by the probable influence of diabetes on the rifampicin exposure. The study aims to evaluate whether diabetes mellitus contribute to the variation of the maximum concentration of rifampicin in patients with tuberculosis treated with a daily dose of 10mg/kg. Rifampicin and glycated hemoglobin were measured by high-performance liquid chromatography, and blood glucose by spectrophotometry. A total of 62 male patients were included in the study, and 26 presented diabetes mellitus. Rifampicin plasma levels in 2-h plasma samples collected at day 61 ranged from 3μg/mL to 14.2μg/mL. Drugs levels were similar between diabetic and non-diabetic patients and were not correlated with blood glucose and glycated hemoglobin. Moreover, a high percentage of patients in both groups presented low levels of rifampicin.
Tuberculosis (TB) is an important public health issue in Brazil, where approximately 76,000 cases are diagnosed each year.1 Rifampicin has a potent sterilizing capacity and is used in both phases of treatment for TB.2 The therapeutic efficacy of rifampicin is dependent on the relationship between drug susceptibility of Mycobacterium tuberculosis and the achievement of adequate blood concentration of the drug. However, there is a high inter-individual variation in blood rifampicin levels after standard dosages, which can lead to suboptimal concentration, unsuccessful treatment, and emergence of resistance.3,4
In recent years, several studies evaluated the effect of type 2 diabetes mellitus (DM) on rifampicin blood levels.5–7 The results were inconclusive, however, with some studies demonstrating significant changes in the pharmacokinetic parameters of the drug while others revealed a moderate or null influence of type 2 DM on rifampicin disposition. In Brazil, no studies have investigated the blood levels of rifampicin in patients with diabetes and tuberculosis. The current study aimed to evaluate whether type 2 DM contributes to the variation of 2-h plasma concentration of rifampicin in Brazilian patients under treatment for tuberculosis.
The study was carried out between January 2017 and July 2018 in the Health Unit of Guama district, Belem, PA, Brazil. The inclusion criteria were adult male patients (>18 years) with clinical, laboratory, and radiological diagnosis of pulmonary tuberculosis. Exclusion criteria were use of anti-tuberculosis drugs in the last 30 days; HIV, hepatitis A, B, C, or E infection; drug addiction including regular consumption of ethanol and tobacco; hepatic or renal diseases; or history of allergy to the anti-tuberculosis drugs. Patients were allocated into two groups: non-diabetic tuberculosis patients (TB group) and type 2 DM tuberculosis patients (TBDM). Type 2 DM was defined as blood glucose levels above 126mg/dL and glycated hemoglobin (HbA1c) above 6.5%.8
Each patient received a total daily dose of rifampicin (600mg), isoniazid (300mg), pyrazinamide (1600mg), and ethambutol (1100mg) for two months (intensive phase), and rifampicin (600mg) plus isoniazid (300mg) for four months (continuation phase). The drugs were dispensed as a fixed-dose combination in both treatment phases. The continuation phase in patients with DM was extended for additional three months.2 The clinical staff of the tuberculosis program from the basic health unit prescribed and dispensed the drugs for free. The first monthly dose was supervised by the research team.
Venous blood samples (4mL) for analysis of rifampicin, blood glucose, and HbA1c were taken on day 61 at 2h after drug intake and after 12h fasting. The samples were centrifuged at 3500g×10min at 4°C for plasma separation. A fraction of plasma was rapidly processed to determine glucose blood levels and HbA1c. The other fraction was refrigerated at −20°C for rifampicin analysis.
Glucose blood levels were determined in an Architect 8000 spectrophotometer (Abbott Diagnostics). HbA1c was measured by ion-exchange high-performance liquid chromatography.8
Rifampicin was measured by reversed-phase high-performance liquid chromatography using a Flexar® system (Perkin Elmer) after liquid–liquid extraction from plasma, following the procedure proposed by Prasanthi et al., 2015 with modifications.9
Qualitative data are presented as frequencies of occurrence and the concentrations of rifampicin in plasma as medians and ranges. The categorical variables were compared between the study groups by the chi-square test. The Mann–Whitney U test was used to compare continuous variables. Correlation of rifampicin plasma levels with blood glucose and HbA1c were evaluated using Spearman coefficient. Data were analyzed using SPSS software, Release 21 (IBM Inc, Chicago, IL, EUA). The significance level accepted was 5%.
The research protocol was revised and approved by the Ethical Committee of the Nucleo de Medicina Tropical da Universidade Federal do Pará (Brazil), under the number 2,711,799. All patients provided informed consent at admission to the study.
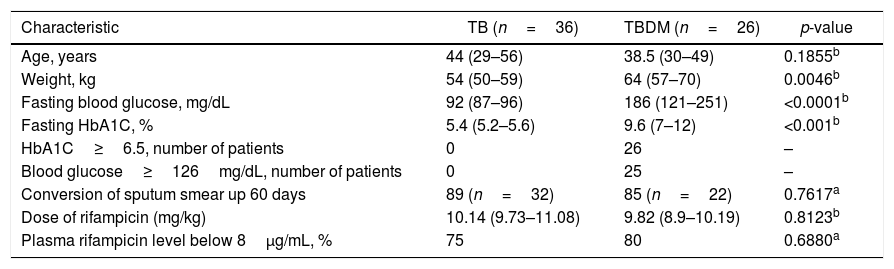
A total of 62 patients completed the study, 26 (42%) with tuberculosis and fulfilled the criteria for type 2 diabetes mellitus. Only four patients reported the use of hypoglycemic drugs. All patients of the TB group showed glucose blood levels and HbA1c within the normal range and did not report use of hypoglycemic drugs. Although the mean weight was higher among TBDM patients compared to TB patients, both groups received similar mean doses of rifampicin (mg/kg). All patients showed negative sputum smear culture within 180 days, and the percentage of sputum culture conversion within 60 days was lower in the TBDM group. Baseline characteristics of the study patients are listed in Table 1.
Baseline characteristics of patients.
| Characteristic | TB (n=36) | TBDM (n=26) | p-value |
|---|---|---|---|
| Age, years | 44 (29–56) | 38.5 (30–49) | 0.1855b |
| Weight, kg | 54 (50–59) | 64 (57–70) | 0.0046b |
| Fasting blood glucose, mg/dL | 92 (87–96) | 186 (121–251) | <0.0001b |
| Fasting HbA1C, % | 5.4 (5.2–5.6) | 9.6 (7–12) | <0.001b |
| HbA1C≥6.5, number of patients | 0 | 26 | – |
| Blood glucose≥126mg/dL, number of patients | 0 | 25 | – |
| Conversion of sputum smear up 60 days | 89 (n=32) | 85 (n=22) | 0.7617a |
| Dose of rifampicin (mg/kg) | 10.14 (9.73–11.08) | 9.82 (8.9–10.19) | 0.8123b |
| Plasma rifampicin level below 8μg/mL, % | 75 | 80 | 0.6880a |
Results are expressed as median and range.
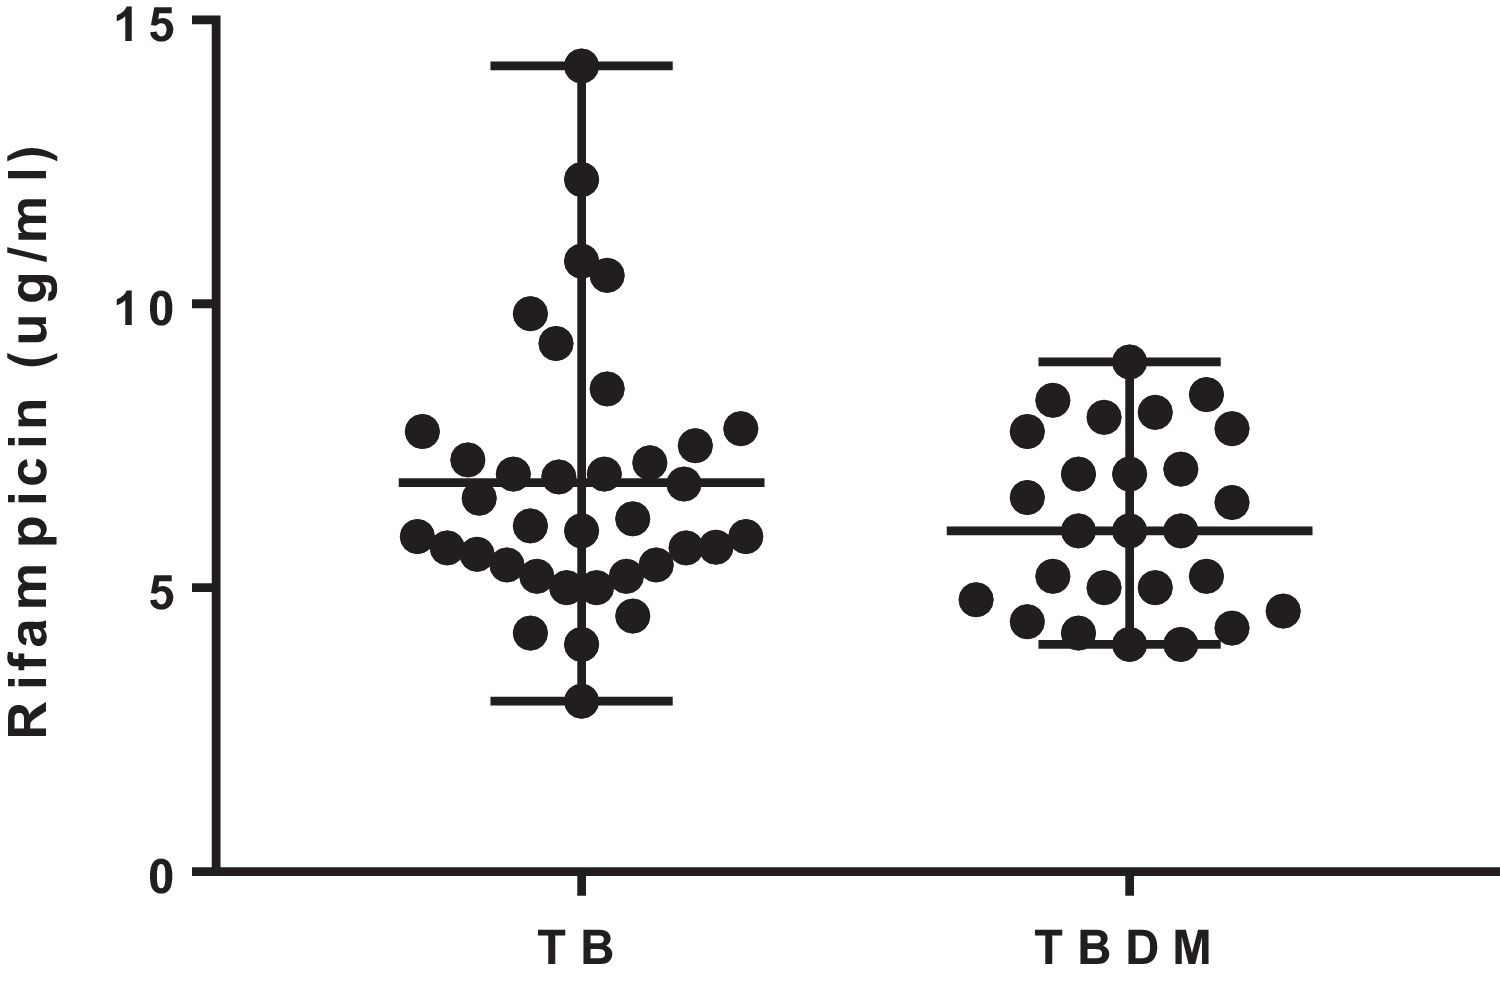
The median 2-h plasma concentrations of rifampicin were 6.16 (3.0–14.2) μg/mL and 6.0 (4–8.9) μg/mL in TB and TBDM patients, respectively. The concentrations of rifampicin were similar in both groups of the study (U=404; p=0.365) (Fig. 1). The percentage of patients with rifampicin concentrations ≤8.0μg/mL was 75% and 80% in TB and TBDM groups, respectively. Plasma concentrations of rifampicin were not significantly associated with blood glucose levels in TB (rs=−0.155; p=0.366) and in TBDM (rs=−0.280; p=0.353) groups. A similar result was found for the association of plasma concentrations of rifampicin with HbA1c in TB (rs=−0.040; p=0.857) and in TBDM (rs=−0.231; p=0.666) groups.
 and with tuberculosis and type 2 diabetes mellitus (TBDM). The horizontal lines correspond to median and range.")
The median 2-h plasma concentrations of rifampicin were chosen to compare drug exposure between the groups of study. Overall, the studies that evaluated the concentrations of rifampicin were performed in samples collected at 2h after drug intake.4,10,11 The mean daily doses of rifampicin given to the patients were similar in both groups and in consonance with the recommendation of the World Health Organization (10mg/kg).2
A high proportion of patients of both groups showed median 2-h plasma concentrations of rifampicin below the therapeutic target for rifampicin (8μg/mL). However, the low level of the drug was not associated with treatment outcome, as all patients showed sputum culture conversion after 180 days. Other studies have also shown a high percentage of patients with adequate therapeutic response after 180 days and median 2-h plasma concentrations of rifampicin below 8μg/mL. The higher percentage of TBDM patients with culture sputum conversion on day 61 is not be considered an adequate predictor of treatment outcome.7,12,13 Additionally, there is a probable influence of the immunomodulatory effect of metformin, which increases sputum culture conversion at 60 days.14
These studies highlighted the importance of attaining target therapeutic concentrations of rifampicin since the drug blood levels are a predictor of treatment outcome.7,12,13 Van Ingen et al. (2011) demonstrated that the 600mg daily dose of rifampicin leads to blood levels above the MIC (0.2μg/mL) against M. tuberculosis, but is at the lower end of the dose–response curve. These authors recommended the use of higher doses of rifampicin to optimize treatment.15
Diabetes mellitus promotes a negative impact on TB treatment outcomes, as patients can show a higher mycobacterial burden, a longer course for sputum conversion, and a greater risk of treatment failure.7,10,11 In this study, most diabetic patients exhibited high levels of blood glucose and HbA1c, revealing poor glycemic control.
The metabolic effects of DM on the disposition of anti-tuberculosis drugs include impairment of drug metabolism, alteration in duodenal efflux pump P-glycoprotein, and pH in the sites of absorption.16,17 In this study, the median 2-h plasma concentrations of rifampicin were similar in both groups, suggesting that DM has no significant effect on rifampicin exposure; this is supported by the lack of significant correlations of rifampicin plasma levels with both the blood glucose and the HbA1c. These data are in line with a study in Indian patients with tuberculosis, which suggests an increase in the dose or to extend the length of treatment in diabetic patients in order to reach similar exposure levels observed in non-diabetic patients.7
The time for blood sampling can be considered a limitation of this study, as 2-h samples could not be the time of maximum drug concentration due to the risk of delayed absorption or malabsorption of rifampicin. However, 2-h samples have been used to assess drug exposure in several studies. Another limitation of the study was the collection of only one blood sample of each patient instead of serial blood samples to estimate the 24-h area-under-the-curve, which could provide a better estimation of the exposure to the drug.4,10,11
In conclusion, the data of the present study suggest that there is no significant effect of diabetes mellitus on the 2-h concentration of rifampicin. Morevoer, a high proportion of patients in both groups presented low blood levels of rifampicin. These data contribute to the comprehension of key points related to the use of rifampicin in the treatment for tuberculosis in Brazilian patients.
FundingThere is no funding source to declare.
Conflicts of interestThe authors declare no conflicts of interest.
