Urinary tract infection (UTI) is the second most common infection in humans after that affecting the respiratory tract. UTI is a severe public health problem that affects 150 million people worldwide each year. It occurs mostly in women, with approximately 20% of them developing one UTI in their lifetime. UTI is a significant cause of morbidity and sequelae such as frequent recurrences, pyelonephritis with sepsis, renal damage, and pre-term birth, contributing to high social and health care costs.1,2 The gold standard for UTI diagnosis is to detect, quantify, and identify pathogens by urine culture.1Escherichia coli is usually the most common of several bacteria which cause UTI.1–3 The objective of this study was to determine the incidence of UTI in the community by assessing the frequency of positive urinary cultures in a large sample of outpatients, and to determine the frequency of uropathogens according to patient characteristics. Community UTI was considered when affecting people who were not hospitalized before the development of symptoms.
The sample included outpatients attended by the public health system (Sistema Único de Saúde, SUS) at Laboratório Municipal de Curitiba (LMC) during a year period. Curitiba is a city with 1,752,000 inhabitants, located at Paraná State, southern Brazil. LMC is a tertiary care government clinical laboratory, highly automated, that attends about 5000 outpatients a day, performing more than 250,000 tests a month.
Patients were classified in groups according to sex and age, and women were classified considering pregnancy, menopause, or diabetes. The criteria used for classification were as indicated in other studies. This study was approved by the Ethics Committee of our institution under the registration number CEP/SD 1225.150.11.90.
The samples were collected by clean-catch midstream of the first urine of the day or, for little children, using collector bags. One microliter of urine was inoculated in chromogenic media CPS ID 3 (BioMérieux, Marcy-I’Etoile, France), and incubated overnight at 36°C. The criteria to consider a culture as positive were growth of a pure culture and colony counts >104CFU/mL.1 Bacteria were identified according to the characteristics developed in CPS ID 3 media or using the Vitek 2 Compact (BioMérieux, Marcy-L’Etoile, France). The CAMP test was used to confirm the identification of Streptococcus agalactiae.
The program MedCalc Statistical Software version 18.9 (MedCalc Software bvba, Ostend, Belgium) was used to compare frequencies with chi-square tests. A p-value less than 5% (p<0.05) was considered significant. Bonferroni correction was applied as appropriate.
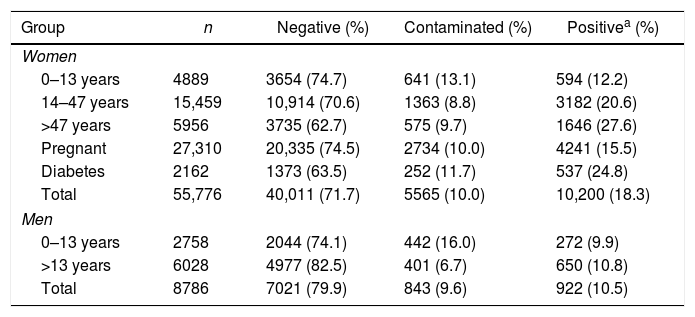
During the period of the study, 64,562 urine cultures were performed at LMC; the results are indicated in Table 1. Most of the urinary cultures (86.4%) were from women. Contaminated specimens were more common among children (Table 1), possibly due, at least in part, to the use of collection bags. When compared to other studies on community UTI, the frequency of positive cultures (17.2%) was similar to that reported by Dromigny et al.,4 which considered only pure cultures with counts ≥104CFU/mL, and higher than that found by Linhares et al.,3 which reported 12.1% of positive cultures. This difference is possibly related to the higher colony counts (≥105CFU/mL) used by Linhares et al.3 to define a positive culture.
Urinary culture results according to the patient subgroups.
| Group | n | Negative (%) | Contaminated (%) | Positivea (%) |
|---|---|---|---|---|
| Women | ||||
| 0–13 years | 4889 | 3654 (74.7) | 641 (13.1) | 594 (12.2) |
| 14–47 years | 15,459 | 10,914 (70.6) | 1363 (8.8) | 3182 (20.6) |
| >47 years | 5956 | 3735 (62.7) | 575 (9.7) | 1646 (27.6) |
| Pregnant | 27,310 | 20,335 (74.5) | 2734 (10.0) | 4241 (15.5) |
| Diabetes | 2162 | 1373 (63.5) | 252 (11.7) | 537 (24.8) |
| Total | 55,776 | 40,011 (71.7) | 5565 (10.0) | 10,200 (18.3) |
| Men | ||||
| 0–13 years | 2758 | 2044 (74.1) | 442 (16.0) | 272 (9.9) |
| >13 years | 6028 | 4977 (82.5) | 401 (6.7) | 650 (10.8) |
| Total | 8786 | 7021 (79.9) | 843 (9.6) | 922 (10.5) |
Legend. Negative, no development of bacteria; contaminated, development of two or more colony types with low counts; positive, pure culture with counts >104CFU/mL.
Statistical difference was observed between the number of positive cultures of women and men (p<0.001); among women, no difference was found between groups of patients with diabetes and >47 years (climacteric) (p=0.084), but significant difference was observed with all other groups (p<0.001); no difference was found between adult men and children (p=0.807). Significative p-value with Bonferroni (0.05/8) correction <0.006.
The frequency of positive cultures (Table 1) was significantly higher among women than among men (p<0.001). The frequency of UTI ranged from 12.2% to 27.6% among women, with the highest frequencies observed in those >47 years old (includes climacteric and geriatric patients) and those with diabetes (p<0.001); there was no significant difference (p=0.043) among these two subgroups. On the other hand, no significant difference in UTI frequency was observed among boys and adult men (p=0.807). These data are in agreement with the literature indicating that the prevalence of UTI is varies according to age and sex, with women and particularly geriatric patients being the most affected.3
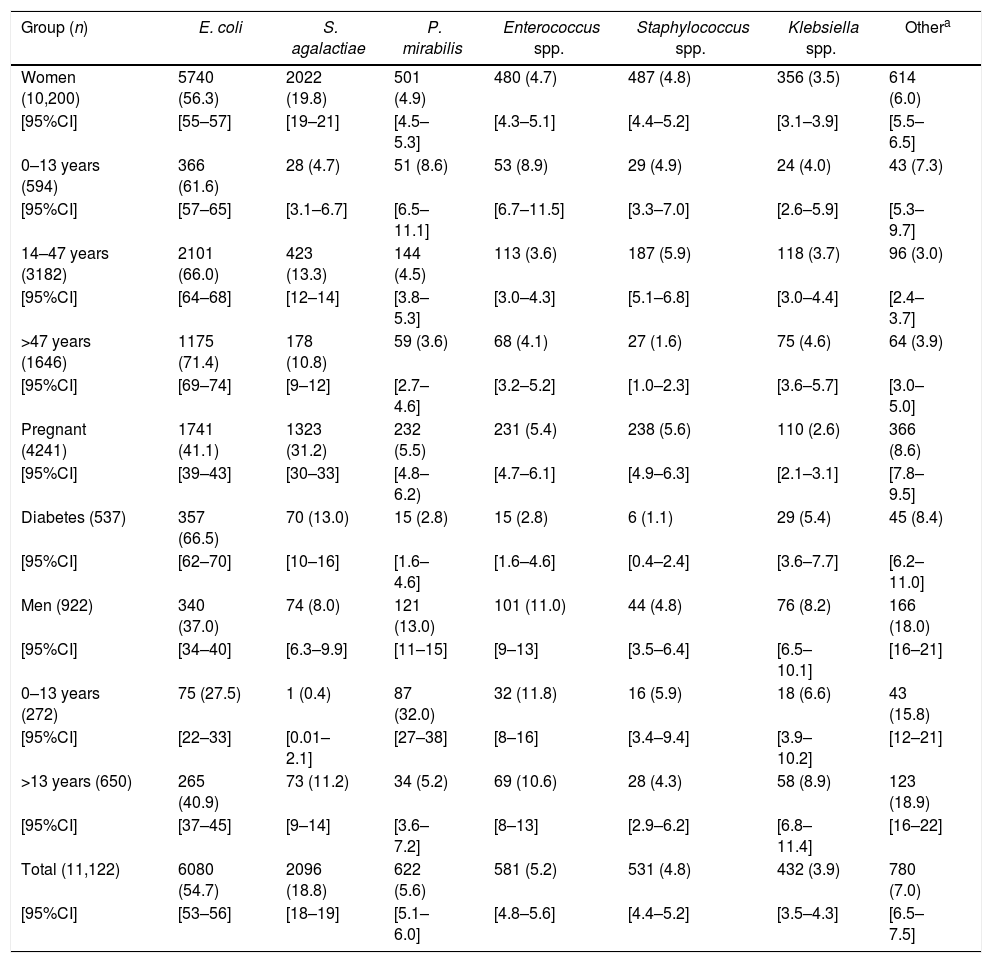
The uropathogens recovered from cultures are indicated in Table 2. E. coli (54.7%) was the most commonly recovered, and the frequency was similar to that of outpatients in other studies – ranging from 38.6% to 72%.1,3,4E. coli prevailed among most patient groups; however, differences were found in its distribution among the patient subgroups (Table 2). The lowest E. coli frequencies were found between pregnant women, men, and boys. These data suggest that although E. coli is the most common uropathogen, its distribution may vary with sex and patient physiological status being lower in men4 and in pregnant women. Of note, the second most common uropathogen was S. agalactiae, with a total frequency of 18.8%, higher than that reported in other studies.2 Dromigny et al.4 reported a frequency of S. agalactiae of 14.3%, comparable to that found in this work, and equally distributed between women and men. In the present study, the S. agalactiae frequency was higher among women (19.8%) than in men (8.0%) and varied among the patient subgroups. Importantly, it was the most commonly recovered pathogen from pregnant women (Table 2). These bacteria are commensal vaginal microbiota in approximately 25% of healthy adult women. However, conditions during pregnancy may lead to increased growth in the urogenital tract. Furthermore, the bacteria can also grow in amniotic fluid. S. agalactiae is a cause of UTI, puerperal infections, and a leading cause of serious infections such as pneumonia, meningitis, and sepsis in neonates.5 In men S. agalactiae was practically found only among adults (Table 2).
Frequency of uropathogens by patient subgroups.
| Group (n) | E. coli | S. agalactiae | P. mirabilis | Enterococcus spp. | Staphylococcus spp. | Klebsiella spp. | Othera |
|---|---|---|---|---|---|---|---|
| Women (10,200) | 5740 (56.3) | 2022 (19.8) | 501 (4.9) | 480 (4.7) | 487 (4.8) | 356 (3.5) | 614 (6.0) |
| [95%CI] | [55–57] | [19–21] | [4.5–5.3] | [4.3–5.1] | [4.4–5.2] | [3.1–3.9] | [5.5–6.5] |
| 0–13 years (594) | 366 (61.6) | 28 (4.7) | 51 (8.6) | 53 (8.9) | 29 (4.9) | 24 (4.0) | 43 (7.3) |
| [95%CI] | [57–65] | [3.1–6.7] | [6.5–11.1] | [6.7–11.5] | [3.3–7.0] | [2.6–5.9] | [5.3–9.7] |
| 14–47 years (3182) | 2101 (66.0) | 423 (13.3) | 144 (4.5) | 113 (3.6) | 187 (5.9) | 118 (3.7) | 96 (3.0) |
| [95%CI] | [64–68] | [12–14] | [3.8–5.3] | [3.0–4.3] | [5.1–6.8] | [3.0–4.4] | [2.4–3.7] |
| >47 years (1646) | 1175 (71.4) | 178 (10.8) | 59 (3.6) | 68 (4.1) | 27 (1.6) | 75 (4.6) | 64 (3.9) |
| [95%CI] | [69–74] | [9–12] | [2.7–4.6] | [3.2–5.2] | [1.0–2.3] | [3.6–5.7] | [3.0–5.0] |
| Pregnant (4241) | 1741 (41.1) | 1323 (31.2) | 232 (5.5) | 231 (5.4) | 238 (5.6) | 110 (2.6) | 366 (8.6) |
| [95%CI] | [39–43] | [30–33] | [4.8–6.2) | [4.7–6.1] | [4.9–6.3] | [2.1–3.1] | [7.8–9.5] |
| Diabetes (537) | 357 (66.5) | 70 (13.0) | 15 (2.8) | 15 (2.8) | 6 (1.1) | 29 (5.4) | 45 (8.4) |
| [95%CI] | [62–70] | [10–16] | [1.6–4.6] | [1.6–4.6] | [0.4–2.4] | [3.6–7.7] | [6.2–11.0] |
| Men (922) | 340 (37.0) | 74 (8.0) | 121 (13.0) | 101 (11.0) | 44 (4.8) | 76 (8.2) | 166 (18.0) |
| [95%CI] | [34–40] | [6.3–9.9] | [11–15] | [9–13] | [3.5–6.4] | [6.5–10.1] | [16–21] |
| 0–13 years (272) | 75 (27.5) | 1 (0.4) | 87 (32.0) | 32 (11.8) | 16 (5.9) | 18 (6.6) | 43 (15.8) |
| [95%CI] | [22–33] | [0.01–2.1] | [27–38] | [8–16] | [3.4–9.4] | [3.9–10.2] | [12–21] |
| >13 years (650) | 265 (40.9) | 73 (11.2) | 34 (5.2) | 69 (10.6) | 28 (4.3) | 58 (8.9) | 123 (18.9) |
| [95%CI] | [37–45] | [9–14] | [3.6–7.2] | [8–13] | [2.9–6.2] | [6.8–11.4] | [16–22] |
| Total (11,122) | 6080 (54.7) | 2096 (18.8) | 622 (5.6) | 581 (5.2) | 531 (4.8) | 432 (3.9) | 780 (7.0) |
| [95%CI] | [53–56] | [18–19] | [5.1–6.0] | [4.8–5.6] | [4.4–5.2] | [3.5–4.3] | [6.5–7.5] |
Includes uropathogens recovered with frequency below 2%, among them Enterobacter spp, Citrobacter spp, Morganella morganii and Pseudomonas aeruginosa. Numbers (n) represent the number of bacteria recovered, percentage is indicated in parenthesis.
[95%CI], 95% confidence interval of percentage, calculated with MedCalc, test for one proportion.
Proteus mirabilis (5.6%) was the third most common uropathogen. Interestingly, it was the most common cause of UTI among boys reaching a frequency of 32% compared to 27.5% of E. coli, while in adult men, its frequency was 5.2% (Table 2). Linhares et al.3 found an incidence of P. mirabilis of 4.7%, similar to that found in the present study. However, among boys 0–12 years the incidence was 2.8%, much lower than that found in the present study, and the bacteria were most common among girls (4.9%), contrasting to our results. Dromigny et al.4 found a total frequency of P. mirabilis of 1.5%, and the bacteria were most common among men. The data shown above suggest that there are geographical differences related to the frequency and distribution of uropathogens in community UTI. Next in frequency, followed bacteria of genera Enterococcus spp., Staphylococcus spp., and Klebsiella spp. with frequencies ranging from 5.2% to 3.9% (Table 2). Differences in their distribution were also found, with the first two genera more frequent among men. Finally, the group “others” including various bacteria whose incidence was <2%, was also more common among men (Table 2).
In conclusion, this study shows an incidence of 17.2% of community UTI. The distribution of the uropathogens differed among patient subgroups and indicates that, although E. coli is usually most common, other bacteria may be equally important for some groups such as S. agalactiae for pregnant women, and P. mirabilis for boys. These results suggest that, in this population, host characteristics may be associated with distinct susceptibility to infection by some uropathogens.
Conflicts of interestThe authors declare no conflicts of interest.
