


COVID-19 is a new disease and the most common complication is pneumonia. The Radiological Society of North America (RSNA) proposed an expert consensus for imaging classification for COVID-19 pneumonia.
ObjectiveTo evaluate sensitivity, specificity, accuracy, and reproducibility of chest CT standards in the beginning of the Brazilian COVID-19 outbreak.
MethodsCross-sectional study performed from March 1st to April 14th, 2020. Patients with suspected COVID-19 pneumonia submitted to RT-PCR test and chest computed tomography (CT) were included. Two thoracic radiologists blinded for RT-PCR and clinical and laboratory results classified every patient scan according to the RSNA expert consensus. A third thoracic radiologist also evaluated in case of discordance, and consensus was reached among the three radiologists. A typical appearance was considered a positive chest CT for COVID-19 pneumonia. Sensitivity, specificity, positive and negative predictive values were calculated. Cohen’s kappa coefficient was used to evaluate intra- and inter-rater agreements.
ResultsA total of 159 patients were included (mean age 57.9 ± 18.0 years; 88 [55.3%] males): 86 (54.1%) COVID-19 and 73 (45.9%) non-COVID-19 patients. Eighty (50.3%) patients had a positive CT for COVID-19 pneumonia. Sensitivity and specificity of typical appearance were 88.3% (95%CI, 79.9–93.5) and 94.5% (95%CI, 86.7–97.8), respectively. Intra- and inter-rater agreement were assessed (Cohen’s kappa = 0.924, P = 0.06; Cohen’s kappa=0.772, P = 0.05, respectively).
ConclusionChest CT categorical classification of COVID-19 findings is reproducible and demonstrates high level of agreement with clinical and RT-PCR diagnosis of COVID-19. In RT-PCR scarcity scenarios or in equivocal cases, it may be useful for attending physicians in the evaluation of suspected COVID-19 pneumonia patients attended at the emergency unit.
Coronavirus Disease 2019 (COVID-19) is a transmissible respiratory disease that rapidly spread around the globe. Since the first case reported in February 2020, Brazil has been severely affected by the epidemic and was the second most affected country in the world, with over three million confirmed cases and more than a 100,000 deaths by the first days of August.1,2 Since the early stage of COVID-19 outbreak in China, chest computed tomography (CT) has been used in the evaluation of patients with suspected COVID-19 pneumonia in the emergency setting, even though it has not been recommended for routine screening or as an isolated diagnostic test.3,4
Although several radiological findings have been associated with COVID-19 pneumonia,5–9 their presence in other diseases hamper CT's reliability for this specific diagnosis.10 Chest CT specificity has broadly ranged in different studies, but the lack of standardized criteria impairs comparisons between them.11 Tomographic standards, such as the Radiological Society of North America (RSNA) expert consensus, British Society of Thoracic Imaging guidance for radiological reporting and COVID-19 Reporting and Data System, have been proposed to overcome these limitations.12–16 These proposed imaging classifications may help clinicians assess the likelihood of COVID-19 pneumonia before molecular test results are available or in settings where the access to these exams are limited.
So far, the majority of studies addressing the role of chest CT in the diagnosis of COVID-19 pneumonia evaluated its performance in Chinese or European populations.12,13,16 The reproducibility of these findings may theoretically change across distinct regions of the globe due to potential differences in the affected population or circulating viruses. In this study, we aimed to evaluate sensitivity, specificity, accuracy, positive and negative predictive values and reproducibility of the RSNA imaging categories for COVID-19 pneumonia in patients evaluated at the emergency department of a referral center for COVID-19 patients in the early period of COVID-19 pandemic in Brazil.
Materials and methodsStudy designThe institutional review board approved the study and informed consent was waived. This was a cross-sectional study with patients presenting with fever or respiratory symptoms, from March 1st to April 14th, 2020, at a COVID-19 dedicated area in the emergency unit of a private hospital. All patients who collected a reverse transcriptase-polymerase chain reaction (RT-PCR) for the diagnosis of COVID-19 were eligible. The study included consecutive patients with suspected pneumonia that underwent chest CT, at the discretion of the attending physician. Chest CT was ordered according to the institutional protocol taking into account pneumonia severity criteria, laboratory tests and comorbidities. Exclusion criteria were age <18 years, lack of data in medical records, and severe respiratory motion artifacts on chest CT.
COVID-19 was confirmed with one positive RT-PCR result. Patients with one negative RT-PCR result were considered non-COVID-19 if clinical, laboratory, and radiological findings indicated a low likelihood of COVID-19. Two consecutive (at least 48 h apart) negative results were required for excluding COVID-19 diagnosis in those judged to have a higher probability of disease, according to the independent evaluation of two infectious diseases specialists of institutional infection control team, as recommended by Infectious Diseases Society of America Guidelines.17
Molecular diagnosisOne oropharyngeal and two nasopharyngeal (from both nostrils) rayon swabs were collected. RNA extraction and real-time RT-PCR were performed at an external laboratory (Grupo Fleury), a reference private laboratory in Brazil, using primer and probes according to the Charité protocol, as previously described.18 Molecular tests for other respiratory pathogens were performed per request of the attending physician, and included either PCR for influenza A (H3N2 and H1N1),19 geneXpert® (Cepheid) for influenza A (H3N2 and H1N1) and B, or FilmArray® PCR Multiplex (Biomérieux), including adenovirus; coronavirus 229E, coronavírus HKU1, NL63 and OC43; human metapneumovirus; influenza A (H3N2 and H1N1) and B; parainfluenza 1,2, 3 e 4; and rhinovirus/enterovirus; Syncytial Respiratory Virus; Bordetella pertussis; Chlamydophila pneumoniae and Mycoplasma pneumoniae.
CT image acquisitionImaging acquisitions were obtained with patients in the supine position during end-inspiration without contrast medium injection. Chest CT was performed on a 16-slice CT (Siemens Emotion 16 Slice CT Scanner, Siemens Healthineers, Forchheim, Germany) and 64-slice CT (Siemens Sensation 64 Slice CT Scanner, Siemens Healthineers, Forchheim, Germany). The following technical parameters were used for both CT scanners: tube voltage 130 kV; tube current modulation 100 mAs; spiral pitch factor 1.4; collimation width 0.625. Reconstructions were made with convolution kernel lung and soft tissue at a slice thickness of 1.00 mm. DICOM data were transferred onto a PACS workstation (Carestream Vue PACS version 12.1.6.1005, Carestream Health, NY, USA).
CT image analysisAll chest CT images were evaluated independently by two radiologists with two and 10 years of thoracic imaging experience. Both readers evaluated every patient scan twice with a 2-day interval between readout sessions to assess intra and inter-rater agreement. Discordant reports were evaluated by a third thoracic radiologist with 12 years of experience and consensus was reached among the three radiologists. All radiologists were blinded for RT-PCR, clinical and laboratory results, and previous imaging exams.
CT features were classified as "typical," "indeterminate," "atypical," and "negative" for COVID-19 pneumonia", according to RSNA expert consensus.15 COVID-19 typical features are peripheral, bilateral and multifocal rounded ground-glass opacities (GGO) with or without consolidation or visible intralobular lines (“crazy-paving”). Reversed halo sign and other findings of organizing pneumonia can be seen later in the disease. Indeterminate features may occur but are nonspecific for COVID-19 pneumonia, such as diffuse, perihilar, or unilateral GGO. All unusual or unreported findings for COVID-19 were classified as atypical (e.g., centrilobular nodules, tree-in-bud opacities, or lung cavitation). If no CT suggestive findings of pneumonia were present, a negative classification was assigned. A typical appearance was considered a positive chest CT for COVID-19.
Statistical analysisStatistical analysis was performed using SPSS version 18.0 (2009, PASW Statistics for Windows. SPSS Inc. Chicago, IL, USA). The association of CT findings and COVID-19 was assessed by univariate analysis using χ² or Fisher's exact test for categorical and Student's t or Wilcoxon Mann-Whitney tests for continuous variables. Sensitivity, specificity, positive and negative likelihood ratio of a positive CT for COVID-19 pneumonia were calculated. Intra- and inter-rater classification agreement beyond chance (appearance and each specific CT findings) and internal consistency reliability were evaluated with Cohen's kappa and Cronbach's alpha coefficients, respectively. Kappa coefficients of 0−0.20, 0.21−0.40, 0.41−0.60, 0.61−0.80, and 0.81–1.00 were considered to indicate none to slight, fair, moderate, substantial, and almost perfect agreement, respectively, and Cronbach’s alpha higher than 0.70 reflects internal consistency.20,21 Positive predictive value (PPV) and negative predictive value (NPV) of the classification according to distinct COVID-19 prevalence were also estimated. A p < 0.05 was considered statistically significant.
ResultsPatient population and clinical dataA total of 1176 patients underwent clinical evaluation for respiratory symptoms. In 443 (37.6%) RT-PCR for SARS-CoV-2 was collected. Of these, a chest CT with suspected pneumonia was reported for 163, four (2.4%) were excluded, and 159 (mean age, 57.9 ± 18.0 years; 88 [55.3%] males) were included in the study: 86 (54.1%) COVID-19 and 73 (45.9%) non-COVID-19 patients (Fig. 1). Out of 36 (22.6%) patients admitted to the intensive care unit during hospitalization, 24 (66.7%) were COVID-19 and 12 were (33.3%) non-COVID-19 patients.

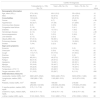
Baseline, clinical and laboratory characteristics of patients were generally similar between COVID-19 and non-COVID-19 groups (Table 1). Age and sex were not significantly different between both groups. Anosmia was significantly more frequent in COVID-19 group. The non-COVID group had a shorter median duration of symptoms before attendance at emergency. COVID-19 patients had significantly lower oxygen saturation at emergency admission, lower leukocyte, lymphocyte, and platelets counts.
Baseline characteristics, presentation signs and symptoms and laboratory results.a
| COVID-19 Diagnosis | ||||
|---|---|---|---|---|
| Total patients (n = 159), No. (%) | Yes(n = 86), No. (%) | No(n = 73), No. (%) | P-value | |
| Demographic Information | ||||
| Age, mean (SD), y | 57.9 (18.0) | 60.0 (15.2) | 55.4 (20.6) | .12 |
| Male | 88 (55.3) | 53 (61.6) | 35 (47.9) | .10 |
| Comorbidities | 103 (64.8) | 58 (67.4) | 45 (61.6) | .40 |
| Cancer | 11 (6.9) | 6 (7) | 5 (6.8) | >.99 |
| Hypertension | 52 (32.7) | 31 (36) | 21 (28.8) | .31 |
| Coronary artery disease | 8 (5) | 3 (3.5) | 5 (6.8) | .57 |
| Congestive heart failure | 3 (1.9) | 0 (0) | 3 (4.1) | .19 |
| Diabetes | 20 (12.6) | 13 (15.1) | 7 (9.6) | .38 |
| Hematologic disease | 2 (1.3) | 1 (1.2) | 1 (1.4) | >.99 |
| Immunosuppression | 8 (5) | 3 (3.5) | 5 (6.8) | .57 |
| Liver disease | 2 (1.3) | 2 (2.3) | 0 (0) | .54 |
| Obesity (BMI ≥ 30) | 97 (61.0) | 56 (65.1) | 41 (56.2) | .64 |
| Pulmonary disease | 33 (20.8) | 14 (16.3) | 19 (26.0) | .21 |
| Smoker | 7 (4.4) | 2 (2.3) | 5 (6.8) | .33 |
| Signs and symptoms | ||||
| Anosmia | 9 (5.7) | 9 (10.5) | 0 (0) | .01 |
| Chest pain | 19 (11.9) | 5 (5.8) | 14 (19.2) | .02 |
| Cough | 114 (71.7) | 67 (77.9) | 47 (64.4) | .06 |
| Diarrhea | 1 (0.6) | 1 (1.2) | 0 (0) | .57 |
| Dyspnea | 86 (54.1) | 49 (57.0) | 37 (50.7) | .42 |
| Fatigue | 82 (51.6) | 29 (57.0) | 33 (45.2) | .15 |
| Headache | 41 (25.8) | 19 (22.1) | 22 (30.1) | .35 |
| Myalgia | 55 (34.6) | 35 (40.7) | 20 (27.4) | .09 |
| Rhinorrhea | 36 (22.6) | 18 (20.9) | 18 (24.7) | .74 |
| Temperature ≥ 37.8 °C | 35 (22.0) | 23 (26.7) | 12 (16.4) | .14 |
| Oxygen saturation ≤93% | 31 (19.5) | 23 (26.7) | 8 (11.0) | .006 |
| Initial laboratory measures | ||||
| Leukocytes, median (IQR), /mm3 | 6820 (4915−9540) | 5930 (4460−7510) | 9230 (6760−11480) | .001 |
| Lymphocyte, median (IQR), /mm3 | 1290 (880−1785) | 1165 (850−1510) | 1610 (970−2150) | .005 |
| Platelets, median (IQR), /mm3 | 188.000 (253.000−144.500) | 166.000 (130.000−204.000) | 218.000 (179.000−273.000) | .001 |
| C-reactive protein, median (IQR), mg/dL | 3.75 (1.10−7.30) | 4.00 (1.80−7.30) | 3.50 (0.60−7.30) | .22 |
| Creatinine, mg/dL, median (IQR), mg/dL | 0.90 (0.70−1.10) | 0.90 (0.70−1.10) | 0.90 (0.70−1.05) | .86 |
| d-dimer, median (IQR), ng/mL | 512.0 (349.0−795.0) | 512.0 (286.5−773.0) | 479.0 (336.0−1256.0) | .96 |
Abbreviations: COVID-19, coronavirus disease 2019; SD, standard deviation; BMI, body mass index; IQR, interquartile range.
Please note, subtitles rows do not have data.
The median time between collecting nasal and oropharyngeal swabs and performing chest CT was 3.6 h (IQR, 1.6–8.3), and the median time from onset of symptoms to undergoing CT was seven days (IQR, 3–9). Eighty (93.0%) COVID-19 patients had their diagnosis confirmed in the first RT-PCR for SARS-CoV-2, while in 6 (7.0%) the first test was negative but the second was positive.
Chest CT standards accuracy for COVID-19Chest CT features were classified as typical in 80 (50.3%) patients, as indeterminate in 30 (18.9%), as atypical in 17 (10.7%) and as negative for COVID-19 pneumonia in 32 (20.1%). The sensitivity, specificity, accuracy, positive and negative likelihood ratio of typical appearance were 88.3% (95%CI 79.9-93.5%), 94.5% (95%CI 86.7-97.8%), 91.1% (95%CI 85.7-94.6%), 16.1 (95%CI 9.8-26.4) and 0.12 (95%CI 0.10−0.14), respectively. The PPV and NPV of typical appearance were 95.0% (95%CI, 88.0%-98.0%) and 87.3% (95%CI, 79.4% - 92.5%), respectively. PPV and NPV according to distinct expected prevalence of COVID-19 among patients with respiratory symptoms are displayed in Fig. 2.
 according to distinct prevalences of COVID-19. A positive chest CT was defined as a typical appearance. Error bars indicate 95% confidence intervals (CI). Positive predictive values (%) and 95% CI according to each estimated prevalence (P): P 10% - 63.6 (40.8-81.9); P 20% - 80.0 (62.5-90.9); P 30% - 87.5 (74.0-94.8); P 40% - 91.8 (81.1-96.9); P 50% - 94.6 (86.0-98.2); P 60% - 96.5 (89.5-99.1); P 70% - 98.0 (92.2-99.6); P 80% - 98.2 (93.1-99.7); P 90% - 99.2 (95.0-99.9). Negative predictive values (%) and 95% CI according to each estimated prevalence (P): P 10% - 98.5 (94.3-99.7); P 20% - 96.7 (91.4 - 98.9); P 30% - 94.6 (88.1-97.7); P 40% - 92.7 (85.2-96.8); P 50% - 89.3 (80.1-94.6); P 60% - 84.5 (73.5-91.6); P 70% - 77.6 (64.4-87.0); P 80% - 66.6 (50.9-79.5); P 90% - 46.8 (29.5-64.9).")
Positive and negative predictive values of a positive chest computed tomography (CT) according to distinct prevalences of COVID-19. A positive chest CT was defined as a typical appearance. Error bars indicate 95% confidence intervals (CI).
Positive predictive values (%) and 95% CI according to each estimated prevalence (P): P 10% - 63.6 (40.8-81.9); P 20% - 80.0 (62.5-90.9); P 30% - 87.5 (74.0-94.8); P 40% - 91.8 (81.1-96.9); P 50% - 94.6 (86.0-98.2); P 60% - 96.5 (89.5-99.1); P 70% - 98.0 (92.2-99.6); P 80% - 98.2 (93.1-99.7); P 90% - 99.2 (95.0-99.9).
Negative predictive values (%) and 95% CI according to each estimated prevalence (P): P 10% - 98.5 (94.3-99.7); P 20% - 96.7 (91.4 - 98.9); P 30% - 94.6 (88.1-97.7); P 40% - 92.7 (85.2-96.8); P 50% - 89.3 (80.1-94.6); P 60% - 84.5 (73.5-91.6); P 70% - 77.6 (64.4-87.0); P 80% - 66.6 (50.9-79.5); P 90% - 46.8 (29.5-64.9).
Only four patients presented a typical appearance and were not confirmed as COVID-19 in two RT-PCR exams; an alternative diagnosis could not established in two cases and were considered as possible COVID-19 pneumonia by the attending physicians. Of the remaining two patients, one had pulmonary thromboembolism with pulmonary infarction diagnosed through magnetic resonance angiography performed three days after chest CT and the other patient had bacterial community-acquired pneumonia. The typical finding in these latter two patients was peripheral and bilateral rounded GGO with consolidation.
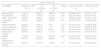
Commonly typical features reported in COVID-19 pneumonia were multifocal, rounded and peripheral GGO displaying a sensitivity of 95.3% (95%CI 88.5-98.7), 82.5% (95%CI 72.8-89.9) and 81.7% (95%CI 71.6-89.3), respectively (Table 2; Fig. 3). All patients with atypical appearance (n = 17) on chest CT were not diagnosed with COVID-19 by RT-PCR. Of these, according to their attendant physician, 13 had the final diagnosis of bacterial pneumonia, one had decompensated heart failure and three had no confirmed alternative diagnosis. The most common findings among these patients were centrilobular nodules (n = 15) and tree-in-bud opacities (n = 7) (Fig. 4). Among patients with indeterminate appearance (n = 30), seven had a positive RT-PCR for SARS-CoV-2. In this group, common findings were very few and non-rounded GGO (n = 4), diffuse GGO (n = 2), and unilateral features (n = 1) (Fig. 5). One of them also had radiological features of pulmonary fibrosis.
Association between typical findings and COVID-19 pneumonia diagnosis.
| COVID-19 Diagnosis | ||||||
|---|---|---|---|---|---|---|
| CT findings | Patients (n = 159) No. (%) | Yes (n = 86)No. (%) | No (n = 73)No. (%) | P-value | Sensitivity %(95% CI) | Specificity %(95% CI) |
| Multifocal GGO | 107(67.3) | 82(95.3) | 25(34.2) | <.001 | 95.3(88.5−98.7) | 65.7(53.7−76.4) |
| Rounded GGO | 82(51.6) | 71(82.6) | 11(15.1) | <.001 | 82.5(72.8−89.9) | 84.9(74.6−92.2) |
| GGO + consolidation | 72(45.3) | 47(54.7) | 25(34.2) | .01 | 54.6(43.5−65.4) | 65.7(53.7−76.4) |
| Crazy-paving pattern | 75(47.2) | 60(69.8) | 15(20.5) | <.001 | 69.7(58.9−79.2) | 79.4(68.3−88.0) |
| Perilobular patterna | 58(36.5) | 56(65.1) | 2(2.7) | <.001 | 65.1(54.0−75.0) | 97.2(90.4−99.6) |
| Reversed halo signa | 28(17.6) | 27(31.4) | 1(1.4) | <.001 | 31.4(21.8−42.3) | 98.6(92.6−99.9) |
| Subpleural linesa | 58(36.5) | 49(57.0) | 9(12.3) | <.001 | 56.9(45.8−67.6) | 87.6(77.8−94.2) |
| Fibro retractile opacitya | 54(34.0) | 43(50.0) | 11(15.1) | <.001 | 50.0(39.0−60.9) | 84.9(74.6−92.2) |
| Bilateral | 105(66.0) | 81(94.2) | 24(32.9) | <.001 | 97.6(91.5−99.7) | 42.9(27.7−59.0) |
| Lower predominance | 64(40.5) | 42(49.4) | 22(30.1) | .11 | 51.8(40.4−63.1) | 43.5(27.8−60.3) |
| Peripheral (any finding) | 84(52.8) | 67(77.9) | 17(23.3) | <.001 | 81.7(71.6−89.3) | 52.7(35.4−69.5) |
Abbreviations: COVID-19, coronavirus disease 2019; CT, computed tomography; CI, confidence interval; GGO, ground-glass opacities.
. B, 47-year-old man presented with 10-day history of moderate breathlessness and fever. Axial CT shows reversed halo sign. C, 70-year-old woman presented with 9-day history of mild dyspnea and COVID-19 exposure. Axial CT shows GGO with a perilobular pattern. D, 36-year-old man presented with 5-day history of fever, cough and myalgia. Axial CT shows bilateral areas of crazy-paving pattern.")
Nonenhanced high-resolution chest CT of different patients with confirmed COVID-19 pneumonia and typical findings. A, 74-year-old man presented with 7-day history of fever and cough. Axial CT shows multifocal, peripheral and rounded ground glass opacities (GGO). B, 47-year-old man presented with 10-day history of moderate breathlessness and fever. Axial CT shows reversed halo sign. C, 70-year-old woman presented with 9-day history of mild dyspnea and COVID-19 exposure. Axial CT shows GGO with a perilobular pattern. D, 36-year-old man presented with 5-day history of fever, cough and myalgia. Axial CT shows bilateral areas of crazy-paving pattern.

Nonenhanced high-resolution chest CT of different patients with atypical findings. A, 52-year-old man presented with 3-day history of fever, cough and adynamia. Axial chest CT shows centrilobular nodules, tree-in-bud opacities and bronchial mucocele. The patient was diagnosed with pulmonary tuberculosis. B, 26-year-old woman presented with 10-day history of cough, sputum, fever and dyspnea. Axial chest CT shows lobar consolidation. The patient was diagnosed with bacterial acquired community pneumonia. C, 47-year-old woman presented with 30-day history of headache, adynamia, cough and chest pain. Axial chest CT shows pulmonary cavitation with satellite centrilobular opacities. The patient was diagnosed with central nervous system and pulmonary cryptococcosis. D, 55-year-old man presented with 3-day history of orthopnea, precordial pain and cough. Axial chest CT shows bilateral pleural effusion, interlobular septal thickening, and centrilobular ground glass opacities. The patient was diagnosed with congestive heart failure due to myocardial infarction.

Nonenhanced high-resolution chest CT of different patients with indeterminate findings. A, 40-year-old man presented with 5-day history of worsening of chronic cough, dyspnea and fever. Axial CT shows diffuse and bilateral ground glass opacities. The patient was diagnosed with acquired immunodeficiency syndrome and Pneumocystis pneumonia. B, 55-year-old man presented with 3-day history of cough and mild breathlessness. Axial CT shows unilobar, rounded and peribroncovascular ground glass opacity. COVID-19 pneumonia was confirmed.
A total of 33 (41.2%) patients with typical findings were tested for influenza by molecular methods (three of them for all other pathogens described in Methods; two were patients with negative SARS-CoV-2 RT-PCR) and none had positive results. Molecular tests for influenza were negative in other five (16.7%; one also negative for other pathogens), three (17.6%) and five (15.6%; one also negative for other pathogens) patients with indeterminate, atypical, and negative CT findings, respectively.
Chest CT standards intra- and inter-rater reliabilityIntra-rater agreement in assigned classification was seen in 282 (88.7%) of 318 observations. Regarding intra-rater agreement, Cohen’s kappa of observer one was 0.847 (P = .13), and observer two was 0.924 (P = .06). Inter-rater agreement ranged from 0.725 (P = .001) to 0.772 (P = .05) between two radiologists (see Tables S1 and S2). The agreement coefficients of selected typical findings are shown in Table S3.
DiscussionAlthough Brazil is currently the second most affected country worldwide in number of cases and deaths,1 there is little data regarding chest CT evaluation of COVID-19 pneumonia in the country, as well as in South-american population. Evaluation of a diagnostic method in distinct populations is of paramount importance to ensure reproducibility of the method in different epidemiological scenarios, including potentially distinct baseline clinical characteristics and circulating viruses. Our study demonstrated that typical appearance on chest CT had high specificity for COVID-19 pneumonia in a Brazilian population. The likelihood of COVID-19 pneumonia diagnosis in patients with a typical CT pattern was substantially higher (PLR = 16.1) than in patients with non-typical findings. Two other studies have assessed the accuracy of the RSNA criteria in Brazilian patients.22,23 In the study of Santos et al. both sensitivity (83%) and specificity (97%) were similar to our results. Barbosa et al. evaluated oncologic patients and found lower sensitivity (64.0%) and specificity (84.8%) rates in that specific population. These results are comparable to those demonstrated in a recent study evaluating Italian patients, in which the authors used the same radiological criteria and found that a typical pattern had an specificity of 91.6% for COVID-19 pneumonia.24 Other Chinese and Italian studies performed in the early COVID-19 pandemic showed much lower specificity rates (25.0% to 56.0%) for chest CT;6,25 However, those studies have not addressed the chest CT criteria proposed by RSNA, which may have affected their results owing to the lack of standards in CT interpretation.6,25 Finally, a recent meta-analysis found a pooled specificity of 37.0% for chest CT.26 However, as considered by the authors, there was significant heterogeneity among the studies.26 We believe that it was mostly caused by the fact that studies using non-standardized criteria for interpretation were included in the analysis.
Only four patients with typical CT findings were not diagnosed with COVID-19 by RT-PCR. Although all had negative RT-PCRs, this diagnosis could not be ruled out in at least two of them, who had no alternative diagnosis during hospitalization (Fig. 6). Additionally, one patient had pulmonary embolism, which is a possible complication described in COVID-19 patients.27 Other studies also showed similar findings related to some false negative RT-PCR results with typical chest CT appearance.28–31
. A and B, axial, C, sagittal chest CT shows a typical appearance, with bilateral and rounded ground-glass opacities with predominant peripheral distribution. The diagnosis of COVID-19 pneumonia couldn")
Nonenhanced high-resolution chest CT of a 79-year-old man presented with 7-day history of dyspnea, adynamia and COVID-19 exposure (wife and job colleague diagnosed with SARS-CoV-2 pneumonia). A and B, axial, C, sagittal chest CT shows a typical appearance, with bilateral and rounded ground-glass opacities with predominant peripheral distribution. The diagnosis of COVID-19 pneumonia couldn't be ruled out, even though with two negative RT-PCR. The patient had no alternative diagnosis during hospitalization and he obtained complete resolution mptoms and CT findings in a 6-month follow-up visit.
A previous study has assessed the RSNA classification inter-rater reliability, with moderate to substantial agreement results.32 Our study reinforces these findings, demonstrating an almost perfect intra-rater and substantial inter-rater agreements. These are encouraging outcomes, suggesting that the classification may be useful for clinicians to accurately estimate their suspicion for COVID-19 pneumonia before RT-PCR results become available and increase the confidence in imaging classification, especially in settings where molecular tests are restricted or unavailable. Actually, in pandemic scenarios where the expected COVID-19 prevalence in patients with respiratory symptoms is above 30%, the PPV of typical CT appearance was higher than 80%. Moreover, it was higher than 90% when the prevalence was above 40%, making imaging classification a reliable tool to identify highly suspicious cases of SARS-CoV-2 pneumonia.
Even though typical appearance sensitivity was near 90%, it is not possible to rule out the diagnosis with a non-typical appearance, particularly in the high prevalence scenario. Previous studies suggested a high sensitivity for CT; however, the lack of clear definitions for positive CT findings impairs the generalizability of those findings.25,26,33 On the other hand, it is important to highlight that the diagnosis of COVID-19 pneumonia was correctly excluded in all patients classified as atypical, suggesting that this classification may be useful to discourage the diagnosis of COVID-19 pneumonia. Seven of 86 (8.1%) COVID-19 patients presented an indeterminate CT classification. This means that the diagnosis of COVID-19 pneumonia cannot be confirmed or ruled out in patients with an indeterminate CT.
Among typical findings, the most frequent were multifocal and rounded GGO, crazy-paving, and perilobular pattern, usually peripheral and bilateral. Interestingly, despite discordance among readers regarding some isolated typical CT signs, there was agreement in the final standard. It is noteworthy that each radiological finding should not be considered individually, considering that these features are not uniquely related to COVID-19 pneumonia. Even noninfectious diseases may present findings that might overlap with CT features related to SARS-CoV-2 infection, such as pulmonary edema, organizing pneumonia, drug-related toxicity, pulmonary infarcts, and interstitial lung diseases.34–37 Furthermore, coinfection with other viruses cannot be ruled out using only chest CT. However, it is noteworthy that the study was conducted in a period before the influenza season in our region and, in addition to our data on molecular tests for influenza, it should be highlighted that, during the study period, only one case of severe acute respiratory syndrome caused by influenza was reported to the Municipal Health Secretary, in mid March and from another institution (https://opendatasus.saude.gov.br/dataset/bd-srag-2020).
Our study has limitations and must be interpreted accordingly. First, there was not a previously defined criteria for ordering RT-PCR and chest CT and, during the study period, RT-PCR was mostly collected from patients showing signs of moderate or severe disease. Therefore, COVID-19 patients presenting with mild disease and pneumonia could have been discharged with no further imaging and laboratory investigations. Second, it was a single-center experience with thorax-experienced radiologists, and scans readings may be less precise when evaluated by general radiologists. Third, our findings are applicable to patients with acute moderate and severe respiratory symptoms performing chest CT during a COVID-19 epidemic period. Finally, alternative diagnoses for non-COVID-19 patients were not fully evaluated in all patients. However, as discussed above, two of the four patients with "typical" appearance and negative RT-PCR were considered as non-laboratory confirmed COVID-19 by attendant physicians before hospital discharge.
In conclusion, in patients with suspected COVID-19 pneumonia, chest CT categorical classification of COVID-19 findings is reproducible and demonstrates high agreement with clinical and RT-PCR diagnosis of COVID-19. Our study reinforces the role of tomographic standards to improve accuracy of radiological reports and to help physicians diagnosing COVID-19 pneumonia.
Funding sourcesThis research did not receive any specific grant from funding agencies in the public, commercial, or not-for-profit sectors.
DisclosuresRDG, VBB, APZ, FTH, LCAJ, JFPS, GSG and MBG: none.
APZ* is a research fellow of the National Council for Scientific and Technological Development (CNPq), Ministry of Science and Technology, Brazil and has received a research grant from Pfizer not related to this work.
We would like to thank research consultants Aline da Cunha and Cássia Pagano, and the statistician Charles Ferreira from “Núcleo de Apoio à Pesquisa do Hospital Moinhos de Vento”.
The following are Supplementary data to this article:

