
Routinely reporting minimum inhibitory concentration (MIC) values to clinicians remains controversial. We surveyed clinicians to assess their knowledge and usage of MIC in clinical scenarios. The majority of respondents used MIC values to select antibiotic therapy, with a tendency to use those antibiotics with lower MICs, regardless of clinical appropriateness.
Minimum Inhibitory Concentration (MIC) refers to the minimum concentration of an antimicrobial agent that visibly inhibits growth of a microorganism. It is one of the most ubiquitous results of antimicrobial susceptibility testing (AST). Despite its reproducibility, MIC can vary depending on methods and mediums employed, length of bacterial incubation, and inoculum.1,2
Whether MIC should be regularly reported to non-laboratory clinicians along with MIC interpretations (resistant, intermediate, susceptible, susceptible dose-dependent, etc.) remains a topic of debate.3 Antibiotic selection is influenced by many factors including provider familiarity with the medication, cost, ease of administration, perceived effectiveness, concern for side effects, and nudging techniques.4 To our knowledge no study has been published on clinicians’ comprehension of MIC values or desire to receive MIC information.
We created an online survey to assess clinicians’ knowledge of MIC and test how they use it in clinical scenarios (Supplement). This survey was submitted to non-infectious diseases residents, fellows, advance practice providers and faculty across multiple hospitals (with independent microbiology laboratories) under a single umbrella healthcare system. Some of the hospitals included in the survey routinely release MIC values while others do not. Many clinicians practice at multiple sites and may have variable exposure to and knowledge of MIC. A request for participation was first sent to department heads and program coordinators who forwarded the link to the survey via email. This project was deemed to be exempt by the Emory University Institutional Review Board.
Survey respondents were provided a set of clinical vignettes to elucidate real-world responses to MIC data. The first vignette included a clinical case without MIC data. Respondents were asked to select the most appropriate antibiotic to prescribe. They were then given a second, microbiologically comparable case with MIC and interpretation data provided (Supplement). Respondents were again asked to select the most appropriate antibiotic to prescribe. After each vignette clinicians were asked to provide reasons for their antibiotic selection in free text. Following these vignettes, respondents were asked a series of multiple-choice questions to assess their knowledge of MIC. Questions were asked sequentially as described above so as not to bias respondents. Providers were not informed of the MIC focus of the survey prior to completing it and instead were informed they were taking a survey regarding general microbiology results. Responses were anonymous. Survey data was analyzed using descriptive statistics.
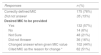
Of the 230 survey respondents, 47% self-identified as attending physicians, 23% as resident physicians and 13% as advanced practice providers. A majority identified as surgical or internal medicine clinicians, including associated sub-specialties. Seventy-six percent correctly defined MIC when given multiple choice options, and 57% wanted MIC data routinely available to them (Table 1).
Survey responses.
| Responses | n (%) |
|---|---|
| Correctly defined MIC | 175 (76%) |
| Did not answer | 35 (15%) |
| Desired MIC to be provided | |
| Yes | 132 (57%) |
| No | 14 (6%) |
| Not Sure | 48 (21%) |
| Did not Answer | 36 (16%) |
| Changed answer when given MIC value | 102 (44%) |
| Cited MIC as the reason for change * | 62 (51%) |
Abbreviations: MIC: Minimum Inhibitory Concentration.
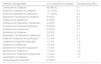
When provided comparable clinical vignettes, 44% of clinicians changed their antibiotic selection when provided with MIC data (Table 2). Of clinicians who changed their answer, 51% cited the MIC as the reason for change. A majority of respondents (85%) who changed their antibiotic selection chose a new antibiotic with a lower MIC. Specifically, almost half of providers who changed their answers switched from Ceftriaxone to Cefepime, which provides unnecessary Pseudomonas coverage and can cause neurologic side effects in patients with kidney injury or pre-existing neurologic dysfunction.
Antibiotic changes.
| Antibiotic Change Made | n (% of those who changed) | Corresponding MICs* |
|---|---|---|
| Ceftriaxone to Cefepime | 49 (48.0%) | 2, 1 |
| Ampicillin-Sulbactam to Cefepime | 12 (11.8%) | 8, 1 |
| Ampicillin-Sulbactam to Ceftriaxone | 11 (10.8%) | 8, 2 |
| Piperacillin-Tazobactam to Cefepime | 6 (5.9%) | 8, 1 |
| Ceftriaxone to Gentamicin | 4 (3.9%) | 2, 1 |
| Ceftriaxone to Piperacillin-Tazobactam | 4 (3.9%) | 2, 8 |
| Ceftriaxone to Ampicillin-Sulbactam | 3 (2.9%) | 2, 8 |
| Ceftriaxone to Levofloxacin | 2 (2.0%) | 2, 1 |
| Gentamicin to Cefepime | 2 (2.0%) | 1, 1 |
| Piperacillin-Tazobactam to Ceftriaxone | 2 (2.0%) | 8, 2 |
| Ampicillin-Sulbactam to Levofloxacin | 1 (1.0%) | 8, 1 |
| Cefepime to Ampicillin-Sulbactam | 1 (1.0%) | 1, 8 |
| Cefepime to Ceftriaxone | 1 (1.0%) | 1, 2 |
| Gentamicin to Ampicillin-Sulbactam | 1 (1.0%) | 1, 8 |
| Gentamicin to Ceftriaxone | 1 (1.0%) | 1, 2 |
| Gentamicin to Piperacillin-Tazobactam | 1 (1.0%) | 1, 8 |
| Levofloxacin to Cefepime | 1 (1.0%) | 1, 1 |
| Chose drug with lower MIC | 87 (85%) |
Abbreviations: MIC: Minimum Inhibitory Concentration
Our survey found that a majority of clinicians surveyed could define MIC correctly and wanted MIC values routinely provided. A large proportion of respondents changed their antibiotic choice for clinical cases when provided with MIC values (despite similar microbiological data), and most cited a lower MIC as the reason for change. Our findings raise the concern that, when making antibiotic selections, non-infectious diseases trained clinicians may inappropriately make decisions based on the numerical MIC value rather than evaluating the entire clinical scenario. While MICs are informative, they are not solely predictive of clinical outcomes6 and should not exclusively guide treatment decisions.
Our study has limitations. This survey was distributed across multiple specialties and respondents self-selected to complete a survey about microbiological laboratory results. This may bias our results to reflect the beliefs and attitudes of clinicians who are interested in this topic. Given provider knowledge of MIC is variable, and we targeted clinicians not trained in microbiology or infectious diseases, we may have made some multiple-choice questions (such as defining MIC) overly simplistic. Still our results suggest that consideration should be made prior to routinely releasing MICs with AST results as non-infectious disease trained clinicians may use MIC values inappropriately.
Author contributionsLW contributed to this manuscript thru project conceptualization, data curation, formal analysis, investigation, methodology, and writing (original and review/editing). JS contributed thru project conceptualization, methodology, supervision, writing (review/editing). EB contributed thru writing (reviewing/editing). CK contributed thru project conceptualization, methodology, supervision, writing (reviewing/editing). AB contributed to this manuscript thru project conceptualization, supervision, investigation, methodology, and writing (review/editing).
This research did not receive any specific grant from funding agencies in the public, commercial, or not-for-profit sectors

