
To evaluate the factors associated with plasma concentrations of atazanavir (ATV) in a cohort of well-controlled HIV infected subjects (undetectable viremia).
DesignCross-sectional study where 69 subjects were consecutively enrolled between April and November, 2011.
MethodsPatients had to be on atazanavir for at least six months, undetectable viral load for a period equal to or longer than 12 months, T CD4+ lymphocyte count higher than 200cells/mm3, and aged between 18 years and 70 years old. Exclusion criteria were pregnancy, any neurologic disease, active opportunistic disease, hepatitis or cancer. Atazanavir plasma levels were measured by ultra-performance liquid chromatography.
Results and discussionOverall, 54 patients (mean age of 47 years and 50% women) were included in the analysis. Those without ritonavir (unboosted atazanavir) had statistically lower plasma concentrations than those with ritonavir boosted atazanavir (p=0.001) and total and indirect bilirubin were statistically associated with plasma concentration of atazanavir (r=0.32 and r=0.33 respectively; p<0.05 in both cases). No statistical association was found among gender, ethnicity, age, weight, body mass index (BMI), lipid profile, and the plasma concentration of atazanavir.
ConclusionIn summary, as expected, concomitant ritonavir use was the only factor associated with atazanavir plasma levels. Prospective studies with a larger sample size might help to observe an association of atazanavir concentrations to other characteristics such as body weight, since the p-value showed to be close to significance (p=0.068).
The introduction of highly active antiretroviral therapy (HAART) as the standard of care in HIV infection dramatically decreased mortality rates in such individuals.1,2 However, antiretroviral therapy (ART) may be associated, in the medium and long run, to the development of important side effects, such as insulin-resistance, type-2 diabetes mellitus (DM), hypertension, dyslipidemia, central obesity, metabolic syndrome, and nephrotoxicity.3–8
Atazanavir (ATV), which is typically administered with low-dose ritonavir (/r), has been an important innovation in the treatment of adult HIV infection owing to its ease of dosing, virologic potency, and minimal metabolic toxicity (such as lower effect on lipid and glucose metabolism). Some limitations to this drug are potential interactions with acid-reducing agents and those increased by the use of ritonavir low-dose, such as benign hyperbilirubinemia with jaundice, and nephrotoxicity (including the risk of nephrolithiasis).9
In that context, higher plasma levels of the drug is one of the key factor that might contribute to the development of toxicity.10,11 Therapeutic drug monitoring can be a useful weapon for dose adjustment in order to avoid concentrations that are out of the therapeutic range, thus preventing toxicity.5,12,13 The purpose of this study was to assess the factors associated with plasma concentrations of ATV in HIV infected individuals with undetectable viral load in order to try to prevent toxicities attributed to this drug.
Materials and methodsStudy populationBetween April and November 2011 patients receiving care at the HIV/AIDS Outpatient Clinic of Hospital de Clínicas de Porto Alegre (HCPA), Brazil were consecutively enrolled in the study. Patients had to be on ATV for at least six months, with undetectable viral load (<50copies/mL) for a period equal to or longer than 12 months, with T CD4+ lymphocyte count higher than 200cells/mm3 and aged between 18 and 70 years old. Subjects with neurological conditions who were not able to understand the study, with active opportunistic disease, with hepatitis, with any type of active known neoplasia, and pregnant women were excluded from the study. The study was approved by the HCPA Ethics Review Board (ERB), and all patients signed the informed consent.
Data collectionA questionnaire was administered for collecting additional information such as comorbidities, concurrent medications, time on ATV, time of last dose of ATV, ART regimen used, adverse effects reported by the patient, and adherence to treatment. Body weight, height and body mass index (BMI) were obtained when the patient was included in the study.
Sample collectionsThe blood samples collected by venipuncture for analyzing ATV plasma concentrations were stored in EDTA-containing tubes. The tubes were centrifuged at 2500rpm at 4°C for 10min and the resulting plasma was placed in a properly numbered Eppendorf tube and immediately stored at −80°C until determination of ATV plasma concentration. The researchers who measured the plasma concentrations of the drug were blind to the subjects’ variables.
Determination of ATV plasma concentrationsUltra performance liquid chromatography (UPLC) with diode array detection was the method used to determine ATV plasma concentrations.11 After the liquid–liquid extraction of 0.5mL of plasma with methyl-tert-butyl ether, the analytes were separated on a ACQUITY UPLC BEH® C18 column (2.1mm×150mm, p.d. 1.7μm) eluted with a gradient of triethylammonium phosphate buffer pH 3.0 and acetonitrile. Total running time was 9.5min. Calibration curves were linear in the range of 0.1–10.0μg/mL. The lower limit of quantitation was 0.1μg/mL for ATV. Accuracy ranged from 94.9 to 103.5%. Both interday and intraday coefficients of variation were less than 7.7% for all analytes. Extraction yields were greater than 88.2%.
Statistical analysisPearson correlation was used to measure the association between plasma concentrations of ATV and variables. Student's t test was performed to assess whether there was statistical difference in plasma concentrations of ATV related to RTV in antiretroviral regimen. The correlation between ATV concentration and time of the last dose of this drug was evaluated using Sperman's rank correlation. As there was no association between these variables (data not shown), all subjects were included in the analyses. Logarithmic and reverse transformations were used for the variables treated as non-parametric data. We used a significance level of 5% for all tests. The statistical analysis was performed at the SPSS program, version 19.0.
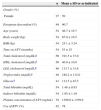
ResultsFrom 150 screened patients, 69 agreed to be enrolled in the study. Out of these, 15 (22%) were excluded: five because they did not come at the time of blood collection; and 10 for not presenting concomitant laboratory tests. Table 1 shows the demographic data of the remaining 54 patients (27 females; 5 Afro-descendents) included in the analyses. The overall mean age (±SD) was 46.7 (±10.7) years. Besides ATV with (n=42) or without (n=12) ritonavir (RTV), the other components of HAART were: zidovudine+lamivudine (3TC) (n=30); tenofovir+3TC (n=19); abacavir+3TC (n=3); and other combinations (n=2). No patient was taking any medication that could interfere with gastric pH (such as antacids or proton pump inhibitors).
Demographic, treatment and biochemical data of the study sample of 54 individuals infected with HIV.
| n | Mean±SD or as indicated | |
|---|---|---|
| Gender (%) | ||
| Female | 27 | 50 |
| European-descendent (%) | 49 | 90.7 |
| Age (years) | 54 | 46.7±10.7 |
| Body weight (kg) | 54 | 67.0±10.5 |
| BMI (kg) | 54 | 25.1±3.24 |
| Time on ATV (months) | 54 | 53±25 |
| Total cholesterol (mg/dL)a | 50 | 191.5±37.0 |
| HDL cholesterol (mg/dL)a | 50 | 40.0±10.8 |
| LDL cholesterol (mg/dL)a | 46 | 113.7±31.6 |
| Triglycerides (mg/dL)a | 48 | 188.2±112.0 |
| Glucosea | 43 | 112.5±45.5 |
| Total bilirubin (mg/dL) | 54 | 1.48±0.93 |
| Indirect bilirubin (mg/dL) | 54 | 1.95±1.19 |
| Plasma concentration of ATV (ng/mL) | 54 | 1399.0±1359.9 |
| Use of RTV (%) | 42 | 78 |
ATV, atazanavir; RTV, ritonavir; SD, standard deviation; BMI, body mass index.
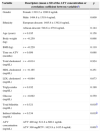
We found no association among gender, ethnicity, age, weight and BMI and ATV plasma concentration (p>0.07) (Table 2), as we also did not observe any relationship with time on ATV (p=0.688). Lipid profile was also not associated with the plasma concentration of ATV (p=0.190). However, as expected, total and indirect bilirubin were statistically associated with plasma concentration of ATV (r=0.32 and r=0.33 respectively; p<0.05 in both cases) (Table 2). Also plasma concentration of ATV was statistically higher (p=0.001) in the group using ATV 300mg daily combined with RTV (mean±SD: 1623.9±1435.6ng/mL; n=42) than in the group using ATV 400mg daily, without the addition of RTV (1623.9±1435.6ng/mL; n=12).
Association between demographic and other variables with ATV plasma concentration (n=54).
| Variable | Descriptors (mean±SD of the ATV concentration or correlation coefficient between variablesa) | p |
|---|---|---|
| Gender | Female: 1303.2±1200.9ng/mL | |
| Male: 1494.8±1519.4ng/mL | 0.609 | |
| Ethnicity | European-descent: 1485.8±1392.8ng/mL | |
| African-descent: 548.6±479.8ng/mL | 0.144 | |
| Age (years) | r=0.195 | 0.158 |
| Body weight (kg) | r=−0.250 | 0.068 |
| BMI (kg) | r=−0.220 | 0.110 |
| Time on ATV (months) | r=0.056 | 0.688 |
| Total cholesterol (mg/dL) | r=−0.014 | 0.924 |
| HDL cholesterol (mg/dL) | r=−0.165 | 0.251 |
| LDL cholesterol (mg/dL) | r=−0.064 | 0.673 |
| Triglycerides (mg/dL) | r=0.192 | 0.190 |
| Glucose (mg/dL) | r=−0.092 | 0.559 |
| Total bilirubin (mg/dL) | r=0.321 | 0.018b |
| Indirect bilirubin (mg/dL) | r=0.334 | 0.019b |
| ATV concentration (ng/mL) | ATV 400mg: 611.8±600.1ng/mL | |
| ATV 300mg/RTV: 1623.9±1435.6ng/mL | 0.001b |
ATV, atazanavir; RTV, ritonavir; SD, standard deviation; BMI, body mass index.
In our study plasma concentrations of ATV was associated with the use of RTV as a component of HAART. Half of our sample included women which allowed us to compare plasma levels between genders. In our study, there was no difference between males and females in regard to ATV concentrations. Likewise, age had no influence on ATV plasma concentrations. These findings are in line with the findings of Hentig et al.,14 who found that ATV/r pharmacokinetics were similar, irrespective of demographic parameters.
Unlike other antiretroviral drugs such as EFZ, the plasma concentration of ATV does not change significantly with body weight, as shown in our study (p=0.068).5 Nevertheless, our limited sample size could have affected this result.
According to the literature, ATV has few effects on serum lipids and it is considered to have a safe metabolic profile.9,15 In our study we were able to show not only that patients did not present dyslipidemia, but also that ATV plasma concentrations had no correlation with serum lipid levels.
This study has some limitations. Collection time was not standardized considering the time when the last dose of ATV had been taken. In order to try to minimize this issue, time after last ATV dose and plasma concentration was studied. Although data were not shown, we found no statistical correlation between time of ATV last dose and its plasma concentration (r=−0.177; p=0.233). This finding may suggest that blood time collection in these patients did not influence ATV plasma levels. This result could reflect the steady-state of ATV in the study subjects, i.e., drug plasma concentration variability in samples collected close to the nadir (through) did not significantly differ from that collected close to the peak or the midpoint of the drug administration interval. Lastly, five patients (10.2%) had no detectable ATV levels. This finding was not related to the time since the last pill had been taken and might actually reflect that the patients included in the analysis did not give us the right information. We were also concerned about the accuracy of our data. Therefore we tested the association between ATV plasma concentration and bilirubin measurements. As expected, we found a positive relationship (p<0.001) which strengthened the validity of our information.16
In summary, in this study we found that only RTV use to be associated with ATV plasma levels. Larger studies might further evaluate the possible role of other factors that would probably influence drug plasma levels (such as weight and age).
Conflicts of interestThe authors declare no conflicts of interest.
This work was partially supported by FIPE (Research Incentive Funding) of Hospital de Clínicas de Porto Alegre.
