


Urban heat islands are characterized by high land surface temperature, low humidity, and poor vegetation, and considered to favor the transmission of the mosquito-borne dengue fever that is transmitted by the Aedes aegypti mosquito. We analyzed the recorded dengue incidence in Sao Paulo city, Brazil, in 2010–2011, in terms of multiple environmental and socioeconomic variables. Geographical information systems, thermal remote sensing images, and census data were used to classify city areas according to land surface temperature, vegetation cover, population density, socioeconomic status, and housing standards. Of the 7415 dengue cases, a majority (93.1%) mapped to areas with land surface temperature >28°C. The dengue incidence rate (cases per 100,000 inhabitants) was low (3.2 cases) in high vegetation cover areas, but high (72.3 cases) in low vegetation cover areas where the land surface temperature was 29±2°C. Interestingly, a multiple cluster analysis phenogram showed more dengue cases clustered in areas of land surface temperature >32°C, than in areas characterized as low socioeconomic zones, high population density areas, or slum-like areas. In laboratory experiments, A. aegypti mosquito larval development, blood feeding, and oviposition associated positively with temperatures of 28–32°C, indicating these temperatures to be favorable for dengue transmission. Thus, among all the variables studied, dengue incidence was most affected by the temperature.
Urban heat islands (UHI) are areas with minimal vegetation cover and large man-made surfaces (e.g., dark roofs, asphalt lots, and roads) that absorb sunlight, re-radiate heat, and retain less water compared to natural land-cover. These attributes reduce humidity for evaporation and cooling.1 Unfortunately, global warming tends to increase the adverse effects of UHI on human health. When heat waves occur, they lead to increased concentrations of air-borne pollutants in UHI, increasing morbidity and mortality caused by respiratory, heart, and circulatory diseases, typically among elderly persons.2,3 In addition, young children and persons living with chronic illnesses are particularly vulnerable to the pollution and heat stress caused by UHI.4
UHI may also influence the transmission of infectious diseases, especially those transmitted by arthropod vectors whose metabolism is associated with temperature, such as dengue fever, a vector-borne disease of global importance.5,6 Dengue virus infection causes a spectrum of symptoms, ranging from mild febrile illness to fatal hemorrhagic disease. Transmission to susceptible human hosts occur through the bite of an infected Aedes aegypti female, with symptoms appearing after an incubation period of 3–14 days (average, 4–7 days).7 Dengue virus replication is amplified at temperatures >30°C, resulting in the extrinsic incubation period (time required to mosquito become infective after consuming blood from an infected host) being reduced from 12–14 days to 7 days.8 The extrinsic incubation period is also influenced by daily temperature fluctuations, as viral titers decrease when daily temperature fluctuations are ±10°C.9 Thus, UHI may amplify the incidence of dengue fever.
São Paulo is the largest city in Brazil, the capital of São Paulo state, and a major financial, corporate, and commercial center in South America. The city has a high vulnerability to the incidence of dengue fever, because of its socio-economic features, high population density, and the significant influx of persons from other cities and countries. A. aegypti Infestation was first detected in 1993, and the first autochthonous cases were reported in 1999. Autochthonous transmission has been continuous since 2001, and A. aegypti has been endemic in all urban areas since 2007. The incidence during 2010 and 2011 was 53 and 37.9 cases per 100,000 inhabitants, respectively.
In this study, we analyzed the association between the characteristics of UHI and the occurrence of dengue fever in São Paulo, over a two-year period (2010–2011), to identify the factors that may favor dengue transmission, and thereby facilitate effective surveillance and prevention of dengue fever.
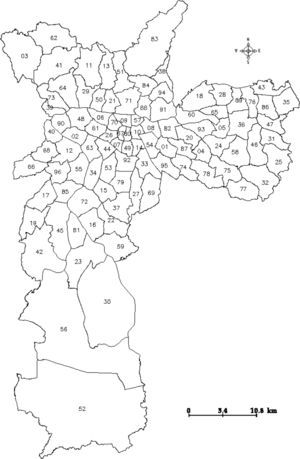
Materials and methodsStudy areaSão Paulo is located in Southeastern Brazil (23°32′51″ S/46°38′10″ W), has an area of 1572km2, a population of over 11,000,000 inhabitants, and is divided into 96 Administrative Districts (ADs). The city has a subtropical climate, with rain in the summer and autumn months (December–May), and dry weather in the winter and spring months (June–November).
Ethics statementWe received approval from the Institutional Review Board of the São Paulo Secretary of Health (Comitê de Ética em Pesquisa da Secretaria Municipal de Saúde do Município de São Paulo) to use de-identified data from blood samples that were collected by public and private health facilities. All animal experiments were performed in accordance to the guidelines of the Institutional Ethics Review Committee (Brazilian Society of Science in Laboratory Animals-SBCAL/COBEA) and the Animal Care Committee of the Institute of Biomedical Sciences (Ethics Committee in Animal Experimentation – CEEA) – University of São Paulo (protocol #014/10).
Dengue dataData regarding dengue cases in São Paulo between 2010 and 2011 were obtained from the Health Surveillance Coordination of São Paulo (COVISA). The majority of cases (99.5%) were classic dengue fever (no complications related to plasma leakage, fluid accumulation, respiratory distress, severe bleeding, or organ impairment). Only cases in which epidemiological investigation indicated the place of residence as the most likely place of infection were included in this study. During 2010–2011, viruses were isolated from 136 patients at the Adolfo Lutz Institute, São Paulo, Brazil, as described previously (serotype 1: 92%; serotype 2: 4%, serotype 3: 4%).10,11
Dengue cases geocodingDengue cases were geocoded according to the patient's home address, using the digital cartographic database of São Paulo (GEOLOG, LOC MSP) and Terraview 4.1.0 software (available at http://www.dpi.inpe.br/terraview/index.php).
Land surface temperature calculation and vegetation cover classificationLand surface temperature (LST) was calculated using thermal remote sensing images from the LANDSAT-5 thematic mapper (TM) to identify temperature zones and UHI in São Paulo. LANDSAT-5 TM multispectral images were selected for their lack of cloud cover. Three satellite images were obtained in 2010 (05/04/2010, 08/24/2010, and 11/28/2010), and three additional images in 2011 (05/23/2011, 07/26/2011, and 11/28/2011). Thermal band (Band 6) was used to calculate the LST in the selected images. Using the image obtained on 07/26/2011, bands 2 and 3 were used to establish the limits for soil and water, respectively, while band 4 was used to determine the vegetation cover. Spectral radiance was calculated, and temperature conversion was performed as described previously.12 Ten different temperature zones (increments of 2°C between 20°C and 40°C) were identified. The average LST for 2010–2011 was obtained using SPRING 5.1.7 software (http://www.dpi.inpe.br/spring/portugues/download.php).13
The supervised classification of images was performed using SPRING 5.1.7 and known São Paulo landmarks (parks, rivers, and urban zones), by applying the Bhattacharya algorithm.14,15 LST and vegetation maps were constructed using vector data (scale, 1/10,000). Vegetation areas were classified as low, moderate, or high cover.
Slum-like areas geocodingA classification of “slum-like” was based on the lack of basic services, substandard housing, and illegal/inadequate building structures. Information regarding slum-like areas was obtained from the 2010 census database of the Brazilian Institute of Geography and Statistics (IBGE). The map of slum-like areas was generated using vector data at 1/10,000 scale using the SPRING 5.1.7.
Kernel density estimation of dengue casesThe Kernel estimation method16 was applied to identify hotspots with a high concentration of reported dengue cases. A spatial point distribution of dengue cases was constructed using the Kernel method and Terraview 4.1.0 to classify the case density in São Paulo.
Population dataPopulation data from census tracts (scale 1/10,000) was obtained from the 2010 census database of the Brazilian Institute of Geography and Statistics. Population density was classified as 0–7000, 7001–10,000, 10,001–20,000, 20,001–30,000, 30,001–40,000, and >40,000 inhabitants/km2. Household income was categorized as <510, 511–1275, 1276–2550, 2551–5100, and >5100US$/month. Land use was categorized as Res-H: predominantly residential houses, Res-B: predominantly residential buildings, NotRes: minimal residential use (typically commercial or industrial), and Wasteland: vacant lots.
Census tract data were converted in a rectangular grid with 5-m resolution (raster data), and the number of inhabitants for each cell was calculated by multiplying the population density by the cell area (25m2) using SPRING 5.1.7. The use of a 5-m resolution grid allowed us to fit all pixels inside census tracts with different sizes and shapes.
Dengue incidenceThe incidence of dengue in the various zones (temperature, vegetation, population density, or slum-like areas) was calculated by dividing the number of cases in that area by the size of its population, and multiplying the quotient by 100,000.
Temperature effects on blood-feeding behavior and oviposition in mosquitoesTwo strains of A. aegypti were used in our laboratory experiments. The white-eyed, Puerto Rico Rexville D (Higgs) strain17 was from our laboratory stocks, while the University of São Paulo (USP) strain was established in 2012 using eggs collected using ovitraps at 23°33′48.50″ S/46°44′35.72″ W and 23°33′49.09″ S/46°44′36.66″ W. Both strains were maintained in a secure insectary (Biosafety Level II) at the Department of Parasitology, Institute of Biomedical Sciences, University of São Paulo, Brazil. Experiments involving the USP strain used F1 progeny from eggs collected in the ovitraps. The mosquitoes were bred and maintained in a controlled atmosphere (27°C, 80% relative humidity, and a 12:12h light:dark cycle). Larvae were fed powdered fish food (Sera, Heinsberg, Germany), and adult mosquitoes had access to 10% sucrose solution ad libitum.
To study the effects of temperature on oviposition, Higgs strain female mosquitoes were blood-fed on mice for 10min (27°C) and divided into four groups of 10 mosquitoes, which were maintained at 20°C, 24°C, 28°C, or 32°C for 96h. A wet surface was provided for oviposition at 72h, and the number of eggs laid in the final 24h was recorded. We also studied the blood-feeding behavior of female Higgs mosquitoes, using groups of 10 mosquitoes that were blood-fed on mice for 10min at 20°C, 24°C, 28°C, or 32°C. Individual weights before and after feeding were recorded, and the group averages were calculated. Although we attempted similar experiments using the USP strain, they did not feed under the experimental conditions.
Data analysisMultivariate cluster analysis (MCA) was used to examine the associations between the incidence of dengue and the socioeconomic and environmental factors.18 Standard analyses (e.g., multiple and logistic regression) could not be applied to our dataset, as it consisted of continuous and categorical variables.19 Although regression models might be used after converting the data (e.g., discretization of continuous data, or creation of dummy variables using categorical variables), they were not used to avoid the introduction of bias.
Twenty-five variables (ten LST ranges, five ranges of household income, four categories of land use pattern, three vegetation cover categories, territorial extension, population density, and proportion of slum-like areas) and 96 ADs were considered. AD data (rather than census tract data) was chosen, given the wide range of census tracts areas (1580–5,172,060m2), which would have jeopardized the evaluation of the tract features’ influence on the incidence of dengue. Given the distinct numerical ranges of the different variables, data were standardized prior to the analysis as follows: standard score=(raw score−mean)/standard deviation.
A dissimilarity matrix of Euclidean distances within each pair of variables was constructed, and a phenogram was built (using complete linkage as the amalgamation rule) to illustrate the calculated distances between the groups. Statistica 10 (Statsoft, Oklahoma, USA) was used to perform multivariate analysis and for graphical outputs.
Data from the laboratory experiments were analyzed using one-way analysis of variance, and the Bonferroni test was used to evaluate inter-group differences. Analyses were performed using BioEstat 5.0 (available at http://www.mamiraua.org.br/pt-br/downloads/programas/).20p-Values <0.05 were considered statistically significant.
ResultsDengue cases in Sao Paulo in 2010–2011During 2010–2011, a total of 7,415 dengue cases were recorded in the existing surveillance systems. Dengue cases were typically concentrated in areas with high LST, and the majority of cases (93%) occurred in areas with LST >28°C; fewer cases occurred in slum-like areas (Fig. 1). Kernel estimation method showed that the highest densities of dengue cases occurred in the north, east, northeast, southeast, and southwest areas (Fig. 2), with LST ranging 30–34°C (Fig. 1A).
, and slum-like areas (B) were geocoded using vector data (scale, 1/10,000). The area outlined in black is the main commercial and financial zone of São Paulo.")

The dengue incidence was higher in high LST areas in the overall city area (Fig. 3, upper panel), and in slum-like areas (Fig. 3, middle panel). A similar result was obtained when the incidence was re-calculated after excluding the slum-like areas from overall São Paulo area. However, in the 20–24°C temperature range a relatively high incidence was calculated because the population density in these areas was low (Fig. 3, bottom panel).
Dengue incidence by population density
The analysis of dengue occurrence based on population density demonstrated that most cases were clustered in highly populated zones (Fig. 4A), although the incidence (in cases per 100,000 individuals) was low in densely populated areas and relatively high in less-populated areas (Fig. 4B).
 Population densities were calculated using census tracts data (inhabitants/km2), and (B) dengue incidence (cases per 100,000 inhabitants) in the population density zones was calculated. The area outlined in black is the main commercial and financial zone of São Paulo.")
Dengue incidence by population density. (A) Population densities were calculated using census tracts data (inhabitants/km2), and (B) dengue incidence (cases per 100,000 inhabitants) in the population density zones was calculated. The area outlined in black is the main commercial and financial zone of São Paulo.
The majority of dengue cases occurred in areas with low vegetation cover (Fig. 5). Zones with high vegetation cover had the lowest incidence rate (3.2 cases per 100,000 inhabitants), while the moderate and low vegetation zones had incidence rates of 50.2 and 72.3, respectively. Areas with high vegetation cover were cooler (26±2°C) compared to areas with moderate or low vegetation cover (both, 29±2°C).
Multiple cluster analysis Dengue cases and vegetation cover areas were geocoded using geographical information systems. (B) The dengue incidence (cases per 100,000 inhabitants) and (C) land surface temperatures in the low, moderate, or high vegetation cover zones are shown.")
MCA of the 96 ADs (Supplementary Information: Fig. S1, Tables S2 and S3) revealed a complex relationship between the incidence of dengue and the socioeconomic and environmental factors (Fig. 6). In the phenogram, dengue incidence was clustered in high-LST areas (32–36°C), while areas with LST <30°C showed a relatively low similarity with dengue occurrence despite the presence of socioeconomic features in the low LST areas that potentially promote disease transmission, like low household income, high population density, and slum-like areas. As would be expected, the slum-like areas clustered with the lowest household income ranges. Areas with low vegetation cover clustered with higher LST (28–30°C), while high vegetation cover clustered with lower LST (22–24°C) (Fig. 6), in agreement with results shown in Fig. 5C.
 for the Administrative Districts of São Paulo. A complete linkage phenogram of Euclidean dissimilarity distances among these variables was plotted. Branches distances are mutually proportional. Abbreviations: Area, territorial extension (km2); Dengue, dengue incidence; LST, land surface temperature; MHI, monthly household income; HVC, high vegetation cover; MVC, moderate vegetation cover; LVC, low vegetation cover; Res-H, predominantly residential houses; Res-B, predominantly residential buildings; NotRes, minimal residential use (typically commercial or industrial); PopDens, population density.")
Multivariate cluster analysis of socioeconomic status, environmental conditions, and dengue incidence (cases per 100,000 inhabitants) for the Administrative Districts of São Paulo. A complete linkage phenogram of Euclidean dissimilarity distances among these variables was plotted. Branches distances are mutually proportional.
Abbreviations: Area, territorial extension (km2); Dengue, dengue incidence; LST, land surface temperature; MHI, monthly household income; HVC, high vegetation cover; MVC, moderate vegetation cover; LVC, low vegetation cover; Res-H, predominantly residential houses; Res-B, predominantly residential buildings; NotRes, minimal residential use (typically commercial or industrial); PopDens, population density.
Supplementary material related to this article can be found, in the online version, at http://dx.doi.org/10.1016/j.bjid.2014.10.004.

Dengue Incidence and socioeconomic aspects from ADs of São Paulo.

Dengue Incidence and environmental aspects from ADs of São Paulo.
The larval development of the Higgs and USP strains was studied at four different temperatures for seven days after the eggs hatched (Fig. 7). At 20°C, the larvae did not reach the pupal stage, while approximately half reached the pupal stage at 24°C (the remaining half were L4 and L3 larval stages). At 28°C and 32°C, the majority of the larvae reached adulthood by day 7.
. Experiments were performed in triplicate. The mean (±standard deviation) percentage of viable individuals on day 7 is presented for the Higgs and University of São Paulo (USP) strains.")
Temperature influence on A. aegypti life cycle. Four groups of fifty larvae each were separated after the eggs hatched, and maintained at 20°C, 24°C, 28°C, or 32°C. On day 7, the number of individuals in the different stages of development was recorded (larval stages L1, L2, L3, L4, or pupae or adults). Experiments were performed in triplicate. The mean (±standard deviation) percentage of viable individuals on day 7 is presented for the Higgs and University of São Paulo (USP) strains.
In another set of experiments to determine the effect of temperature on oviposition, Higgs females that were maintained at 32°C laid a greater number of eggs compared to those maintained at lower the temperatures (Fig. 8A). At 28°C or 32°C, a higher percentage of female mosquitoes fed on mice blood (60% and 76%, respectively) (ANOVA: F=19.1, p=0.0009) compared to those at 20°C and 24°C (Fig. 8B). In addition, the amount of blood taken per mosquito was higher at 28°C and 32°C, compared to that at 20°C and 24°C (ANOVA: F=4.6, p=0.0068) (Fig. 8C).
 female mosquitoes. Four groups of ten female mosquitoes each were blood fed on mice, and maintained at 20°C, 24°C, 28°C, or 32°C for 96h. The number of eggs laid in the last 24h during the temperature exposure was recorded (A). Female mosquitoes were individually weighed (3.3±0.4mg), and divided into groups of 10 mosquitoes each, and the groups were allowed to feed on mice for 10min at 20°C, 24°C, 28°C, or 32°C. The number of blood fed mosquitoes (B) and their individual weight after blood meal (C) was recorded. Experiments were performed in triplicate. The boxes represent the range between the 25th and 75th percentiles. The horizontal line in each box represents the mean value, the circles represent outlier values, and * indicates p<0.01.")
Temperature effects on oviposition and blood-feeding behavior of A. aegypti (Higgs strain) female mosquitoes. Four groups of ten female mosquitoes each were blood fed on mice, and maintained at 20°C, 24°C, 28°C, or 32°C for 96h. The number of eggs laid in the last 24h during the temperature exposure was recorded (A). Female mosquitoes were individually weighed (3.3±0.4mg), and divided into groups of 10 mosquitoes each, and the groups were allowed to feed on mice for 10min at 20°C, 24°C, 28°C, or 32°C. The number of blood fed mosquitoes (B) and their individual weight after blood meal (C) was recorded. Experiments were performed in triplicate. The boxes represent the range between the 25th and 75th percentiles. The horizontal line in each box represents the mean value, the circles represent outlier values, and * indicates p<0.01.
In this study, we used data on thermal remote sensing and geographical information systems to identify UHI in São Paulo city, and studied the influence of environmental and socioeconomic factors potentially associated with mosquito breeding and the incidence of dengue. In addition, laboratory experiments were performed to study the influence of temperature on A. aegypti larval development, oviposition, and blood-feeding, which might affect the transmission of the dengue virus. Among the environmental and socioeconomic factors we evaluated, high LST in UHI was judged as the most influential factor in the increase of dengue incidence.
Previous studies in other global locations have reported an association between the distribution of dengue fever and climatic conditions or land use/cover patterns.21–23 Those studies have indicated that the spatial diffusion patterns of dengue cases and the incidence of dengue are both closely related to LST and various climatic factors (e.g., rainfall, temperature, and humidity).
The variable influence of climate on dengue has been recently reported using a multivariate analysis of factors that are related to dengue transmission dynamics.24 In that study, each city had variable characteristics and micro-climatic oscillations, which must be incorporated into future studies regarding the effects of climate and the environment on mosquito dispersion patterns and modulation of vector density.
Human activities are also important determinants of the transmission of dengue fever and other vector-borne diseases,25 and man-made water reservoirs (e.g., jars, cemetery urns, discarded tires) provide attractive breeding grounds for A. aegypti. In addition, daily activities related to work, rest, recreation, and residential location relative to mosquito breeding sites, and other behavioral and cultural traits can also significantly influence dengue transmission.
The lack of basic services and adequate building structures in slum-like areas are known to promote mosquito proliferation, and consequently, dengue transmission. However, our results indicate that the incidence of dengue does not increase in slum-like areas. Interestingly, a high incidence of dengue was co-localized with high-LST zones in slum-like areas, as well as areas with higher socioeconomic status.
High population density is thought to contribute to dengue transmission by increasing the contact between infected mosquitoes and human hosts. However, high population density areas in São Paulo had a lower incidence of dengue compared to low population density areas. Interestingly, these high population density areas typically consisted of large residential buildings, while the low population density areas typically consisted of individual houses. In contrast, others studies have reported that areas with a predominance of independent houses had higher levels of A. aegypti larval infestation.26,27 This discrepancy is likely due to differences in the availability of mosquito breeding sites, as A. aegypti are only detected in the bottom four floors of residential buildings in cities from São Paulo state (unpublished data). Therefore, only a fraction of the population in the highly populated areas with residential buildings were actually exposed to mosquito contact, and consequently, to the risk of dengue. Similarly, a Vietnamese study reported that infrastructure characteristics (e.g., the lack of water supply), rather than population density, had the greatest effect on the transmission of dengue.28
Vegetation plays a crucial role in controlling temperature fluctuations, and the expansion of urban areas without vegetation is associated more significantly with temperature increases than population growth.29 Our results confirm that low vegetation cover areas present higher LST and higher dengue incidence rates.
The MCA performed in the present study to evaluate the influence of socioeconomic (household income, land use pattern and proportion of slum-like areas), and environmental (vegetation cover pattern and LST) factors on dengue incidence indicated that in São Paulo city, LST was the most influential factor for the transmission of dengue. Interestingly, low socioeconomic status has been reported to affect the incidence of dengue,30 and a close relationship between low socioeconomic status and UHI has been described in other cities.31,32 However, the zones in São Paulo with the lowest socioeconomic status had minimal overlap with UHI or areas with a high incidence of dengue. This discrepancy may be related to the fact that these zones typically do not have paved streets, and were often situated close to high vegetation cover zones, which are factors that contribute to LST reduction.
Previous studies have used mathematical models and simulations to predict the effects of temperature on A. aegypti distribution33 and the transmission of dengue,34 and have indicated that the increase in temperature influences A. aegypti population dynamics, and consequently, dengue virus transmission. Elevated temperatures and small daily temperature fluctuations (conditions observed in UHI) are known to induce higher viral loads in mosquitoes,8,11 which could explain the distribution and incidence of dengue cases described in this study.
The effects of temperature on the metabolic rate of ectothermic organisms such as insects have been demonstrated previously.35 Our laboratory experiments indicated that higher temperatures (28°C and 32°C) shortened the A. aegypti larval development period, and improved their blood feeding and oviposition, which suggests that warmer zones are favorable for mosquito breeding. Therefore, interventions should focus on the recovery of green space and vegetation in UHI, which might mitigate the negative effects of climate change on human health in vulnerable urban populations if urban planning is coordinated with public health programs to control vector-borne diseases. Recognizing UHI as high-risk areas for dengue virus transmission may help facilitate the efficient use of resources for dengue surveillance in endemic countries.
In addition, our results may provide useful information regarding changes in dengue transmission dynamics that may occur in endemic areas that are affected by climate change and global warming.25,36,37
ConclusionsOur results indicate that LST had the greatest impact on the incidence of dengue in São Paulo during 2010–2011, and support the hypothesis that the high temperatures found in UHI favors A. aegypti proliferation and increases blood feeding, thereby increasing the incidence of dengue. We believe these results may be useful in designing public health strategies for dengue surveillance and prevention in areas similar to São Paulo. Therefore, green space expansion should be prioritized in urban planning, as it may reduce the adverse effects of UHI on human health if combined with continued efforts to eliminate mosquito breeding sites and increase public awareness of dengue transmission.
Conflicts of interestThe authors declare no conflicts of interest.
We acknowledge Fernando Yoshiki Nishio and Marcos Paulo Pafume Ribeiro for their technical assistance with the geographical information systems, and our colleagues from the São Paulo Health Surveillance Supervision (SUVIS) for their technical assistance in collecting epidemiological data.
