


We evaluated the kinetics of cytokines belonging to the T helper1 (Th1), Th2, and Th17 profiles in septic patients, and their correlations with organ dysfunction and hospital mortality.
MethodsThis was a prospective observational study in a cohort of septic patients admitted to the intensive care units (ICU) of three Brazilian general hospitals. A total of 104 septic patients and 53 health volunteers (controls) were included. Plasma samples were collected within the first 48h of organ dysfunction or septic shock (0D), after seven (D7) and 14 days (D14) of follow-up. The following cytokines were measured by flow cytometry: Interleukin-1β (IL-1β), IL-2, IL-6, IL-8, IL-10, IL-12/23p40, IL-17, IL-21, tumor necrosis factor-α (TNF-α), granulocyte-macrophage colony stimulating factor (GM-CSF), granulocyte colony-stimulating factor (G-CSF).
ResultsIL-6, IL-8, G-CSF and IL-10 concentrations were higher in septic patients than in controls (p<0.001), while IL-12/23p40 presented higher levels in the controls (p=0.003). IL-6, IL-8 and IL-17 correlated with Sequential [Sepsis-related] Organ Failure Assessment (SOFA) D0, D1 and D3 (except for IL-6 at D0). IL-8 was associated with renal and cardiovascular dysfunction. In a mixed model analysis, IL-10 estimated means were lower in survivors than in deceased (p=0.014), while IL-21 had an estimated mean of 195.8pg/mL for survivors and 98.5 for deceased (p=0.03). Cytokines were grouped in four factors according to their kinetics over the three dosages (D0, D7, D14). Group 1 encompassed IL-6, IL-8, IL-10, IL-1β, and G-CSF while Group 3 encompassed IL-17 and IL-12/23p40. Both correlated with SOFA (D0) (p=0.039 and p=0.003, respectively). IL-21 (Group 4) was higher in those who survived. IL-2, TNF-α and GM-CSF (Group 2) showed no correlation with outcomes.
ConclusionInflammatory and anti-inflammatory cytokines shared co-variance in septic patients and were related to organ dysfunctions and hospital mortality.
Sepsis is a major cause of morbidity and mortality worldwide, with increased burden in low and medium incomes countries: in Brazilian intensive care units (ICU), mortality rates as high as 55% have been reported, which emphasizes the need for clinical studies in this population.1 The immune response to infection is a complex process, involving various types of cells and production of a cascade of cytokines, leading to cell damage and organ dysfunction.2–4 T helper (Th) cells have long been recognized as vital components of the adaptive immune system. Major Th cell subsets include Th1, Th2, and Th17, and each subset produces specific effector cytokines. Th1 lymphocytes produce IFN-γ, TNF and IL-2; Th2 cells secrete IL-4, IL-5, IL-10, and IL-13; and Th17 cells produce effector cytokines IL-17, IL-21, IL-22, and IL-23.5 Studies suggest that Th lymphocytes profiles contribute to autoimmune and inflammatory diseases, including sepsis.6 Septic patients have been reported to present increased percentage of IL-17-producing T helper lymphocytes when compared to healthy volunteers.7 Contrarily, Gupta et al. showed that patients with post-traumatic sepsis (trauma hemorrhagic shock), presented lower Th cells response compared to non-septic patients.8 Recent study evaluated the T CD4+ cells in patients with acute respiratory distress syndrome and found that those patients with an imbalance favoring the Th17 profile presented higher mortality.9 There is a paucity of studies evaluating the kinetics of Th cytokines in sepsis; most of the studies focused on intermittent measurements of few cytokines, providing only a partial picture of the complex immunologic cascade.
Herein, we evaluated a profile of cytokines in plasma of septic patients, encompassing those related to Th1, Th2 and Th17, on days zero, seven and 14 following diagnosis of sepsis in adults and analyzed their time-shared variance and their association with sepsis-induced organ dysfunctions and in-hospital mortality.
MethodsPatients admitted to the ICU of three tertiary hospitals from São Paulo, Brazil, with the diagnosis of severe sepsis or septic shock were included in a prospective observational study between September 2007 and September 2010.10 Severe sepsis and septic shock were defined according to Bone et al.11 and roughly correspond to the sepsis and septic shock of the revised sepsis definition.12
After obtaining informed consent, blood samples were drawn from 104 adult septic patients within the first 48h of organ dysfunction or septic shock, and from 53 healthy volunteers, matched for age and sex. Samples were collected from the septic patients at the time of inclusion (D0), on the 7th (D7) and 14th days (D14) of follow-up. Healthy controls had samples collected only once. This study was approved by the Ethics Committees of Universidade Federal de Sao Paulo (CEP1477/06), Hospital Albert Einstein (CEP07/549), and Hospital Sírio Libanês (CEP2006/27).
For patients and controls, 10mL of blood were collected in heparin tubes. The samples were centrifuged for separation of plasma, which was frozen in aliquots at −80°C until use. The severity of the disease and organ dysfunctions were assessed using the Sequential [Sepsis-related] Organ Failure Assessment (SOFA) scores at days 0, 1 and 3 after ICU admission.13 Cytokines measurements were performed by the Cytometric Bead Array (CBA) Flex Set from BD Biosciences, San Jose, CA, USA.
Data were analyzed with statistical software SPSS version 20.0 (SPSS Inc., Chicago, IL, USA). The significance level was p<0.05. Differences between distributions and means were evaluated by the Mann–Whitney test or T-test. Correlations were evaluated by the Spearman test and linear regression. The 99% confidence intervals of the p values were obtained by bootstrap resampling, with 1000 tables from the sample. Logistic regression (univariate and multivariate) was performed to evaluate risk factors for in-hospital mortality. In order to maximize the explanatory power of the cytokine dataset in the three time-points and to identify correlated subgroups, a factor analysis was performed using the principal components method and Varimax rotation, reducing the number of variables according to the correlation or covariance patterns.
We used mixed model analysis to evaluate oscillations between cytokines measurements over the three time-points and the factor's effect such as septic shock and death.14,15
The area under the receiver-operating characteristic curve (AUROC) was used to evaluate the cytokines accuracy on D0 to predict hospital mortality.
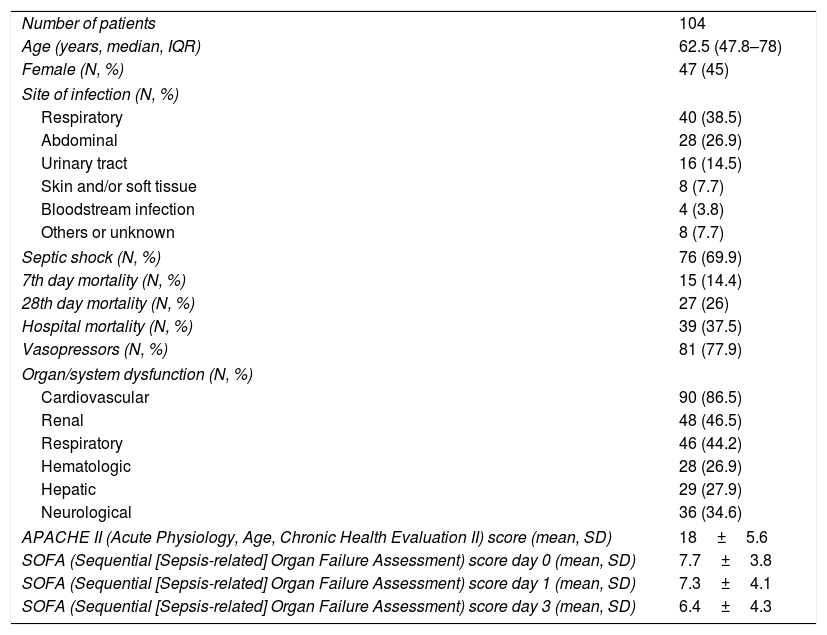
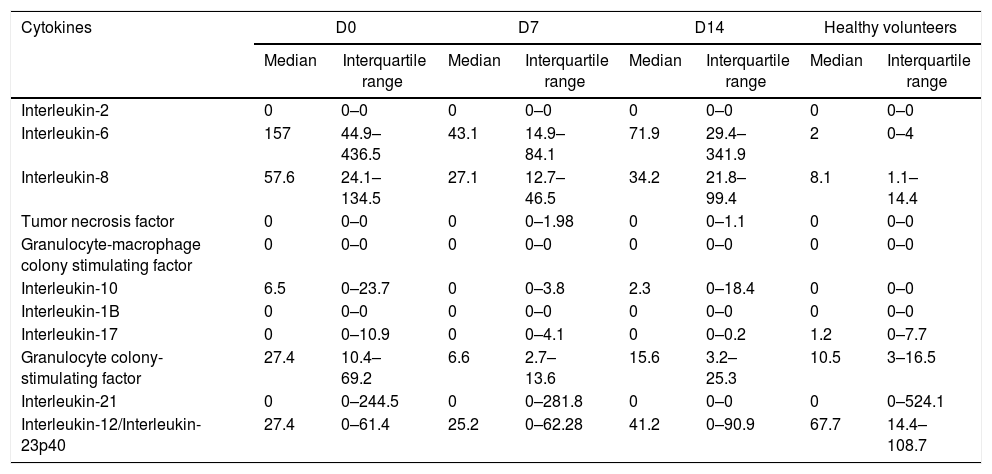
ResultsPatient demographics and clinical data are shown in Table 1. Plasma levels of IL-2, IL-6, IL-8, TNF-α, GM-CSF, IL-10, IL-1β, IL-17, G-CSF, IL-21, and IL-12/23p40 in septic patients (D0, D7 and D14) and in healthy volunteers are shown in Table 2.
Clinical variables and demographic data from septic patients.
| Number of patients | 104 |
| Age (years, median, IQR) | 62.5 (47.8–78) |
| Female (N, %) | 47 (45) |
| Site of infection (N, %) | |
| Respiratory | 40 (38.5) |
| Abdominal | 28 (26.9) |
| Urinary tract | 16 (14.5) |
| Skin and/or soft tissue | 8 (7.7) |
| Bloodstream infection | 4 (3.8) |
| Others or unknown | 8 (7.7) |
| Septic shock (N, %) | 76 (69.9) |
| 7th day mortality (N, %) | 15 (14.4) |
| 28th day mortality (N, %) | 27 (26) |
| Hospital mortality (N, %) | 39 (37.5) |
| Vasopressors (N, %) | 81 (77.9) |
| Organ/system dysfunction (N, %) | |
| Cardiovascular | 90 (86.5) |
| Renal | 48 (46.5) |
| Respiratory | 46 (44.2) |
| Hematologic | 28 (26.9) |
| Hepatic | 29 (27.9) |
| Neurological | 36 (34.6) |
| APACHE II (Acute Physiology, Age, Chronic Health Evaluation II) score (mean, SD) | 18±5.6 |
| SOFA (Sequential [Sepsis-related] Organ Failure Assessment) score day 0 (mean, SD) | 7.7±3.8 |
| SOFA (Sequential [Sepsis-related] Organ Failure Assessment) score day 1 (mean, SD) | 7.3±4.1 |
| SOFA (Sequential [Sepsis-related] Organ Failure Assessment) score day 3 (mean, SD) | 6.4±4.3 |
IQR, interquartile range; SD, standard deviation.
Values of medians and interquartile ranges (pg/mL, IQR, 25–75 percentiles) of cytokines in patients (D0, D7, D14) and healthy controls.
| Cytokines | D0 | D7 | D14 | Healthy volunteers | ||||
|---|---|---|---|---|---|---|---|---|
| Median | Interquartile range | Median | Interquartile range | Median | Interquartile range | Median | Interquartile range | |
| Interleukin-2 | 0 | 0–0 | 0 | 0–0 | 0 | 0–0 | 0 | 0–0 |
| Interleukin-6 | 157 | 44.9–436.5 | 43.1 | 14.9–84.1 | 71.9 | 29.4–341.9 | 2 | 0–4 |
| Interleukin-8 | 57.6 | 24.1–134.5 | 27.1 | 12.7–46.5 | 34.2 | 21.8–99.4 | 8.1 | 1.1–14.4 |
| Tumor necrosis factor | 0 | 0–0 | 0 | 0–1.98 | 0 | 0–1.1 | 0 | 0–0 |
| Granulocyte-macrophage colony stimulating factor | 0 | 0–0 | 0 | 0–0 | 0 | 0–0 | 0 | 0–0 |
| Interleukin-10 | 6.5 | 0–23.7 | 0 | 0–3.8 | 2.3 | 0–18.4 | 0 | 0–0 |
| Interleukin-1B | 0 | 0–0 | 0 | 0–0 | 0 | 0–0 | 0 | 0–0 |
| Interleukin-17 | 0 | 0–10.9 | 0 | 0–4.1 | 0 | 0–0.2 | 1.2 | 0–7.7 |
| Granulocyte colony-stimulating factor | 27.4 | 10.4–69.2 | 6.6 | 2.7–13.6 | 15.6 | 3.2–25.3 | 10.5 | 3–16.5 |
| Interleukin-21 | 0 | 0–244.5 | 0 | 0–281.8 | 0 | 0–0 | 0 | 0–524.1 |
| Interleukin-12/Interleukin-23p40 | 27.4 | 0–61.4 | 25.2 | 0–62.28 | 41.2 | 0–90.9 | 67.7 | 14.4–108.7 |
IL-6, IL-8, IL-10, and G-CSF presented higher plasma concentrations in septic patients (D0) than in healthy individuals (p<0.001), whereas IL-12/23p40 presented higher concentrations in healthy subjects than in septic patients (p=0.003).
Cytokines levels on D0 and correlations with organ dysfunctionsIndividually, IL-6 (D0) was correlated with SOFA (D1) (Spearman rho=0.36; p=0.004) and D3 (rho=0.33; p=0.008), but not with SOFA on D0. IL-8 (D0) correlated with SOFA (D0) (rho=0.27; p=0.007), SOFA (D1) (rho=0.36; p<0.001), and SOFA (D3) (rho=0.34; p=0.001); IL-10 correlated with SOFA (D0) (rho=0.3; p=0.01), SOFA (D1) (rho=0.4; p=0.001), and SOFA D3 (rho=0.26; p=0.045); G-CSF (D0) correlated with SOFA (D1) (rho=0.25; p=0.01) and SOFA (D3) (rho=0.24; p=0.02); IL-17 (D0) correlated with SOFA (D0) (rho=0.23; p=0.01), but there was no correlation with SOFA (D1) or SOFA (D3).
IL-8 (D0) showed higher concentrations in those patients who developed renal dysfunction (patients with renal dysfunction: median=82.3, IQR: 41.8–138.5, without dysfunction: median=45.6pg/mL, IQR: 16.5–168.3pg/mL; p=0.04) and cardiovascular dysfunction (patients with cardiovascular dysfunction: median=68.3pg/mL, IQR: 28.7–68.3; without dysfunction: median=23.9pg/mL, IQR: 5.6–68.4; p=0.01). G-CSF (D0) concentrations were higher in patients with cardiovascular dysfunction (patients with cardiovascular dysfunction: median=30.4pg/mL, IQR: 11.2–73.7; without dysfunction: median=11.0, IQR: 3.3–41.2; p=0.03).
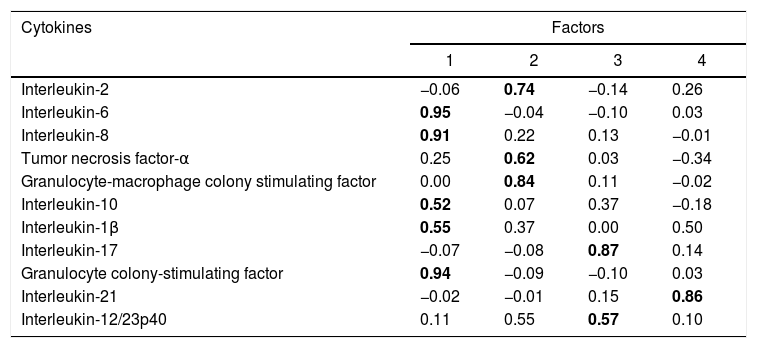
Factor and mixed model analysisCytokines were included in a factor analysis model comprising the three measurements. The cumulative total variance explained by the model was 72.7%, with a Kaiser–Meyer–Olkin test of sampling adequacy of 0.70 and Bartlett's sphericity test with p<0.001. The model reduced the 11 variables to four factors, or latent variables, presented in Table 3. Factor 1 corresponds to the factorial loadings of IL-6, IL-8, IL-10, IL-1β and G-CSF. Factor 2 represents IL-2, TNF-α and GM-CSF loadings; Factor 3, the loadings of IL-17 and IL-12/23p40. IL-21 was the cytokine that shared the least variance, being the highest loading in Factor 4. Fig. 1 shows the plot of components after Varimax rotation.
Factor analysis loadings of the four factors of the solution, after Varimax rotation. Values in bold show the most significant loading for each factor.
| Cytokines | Factors | |||
|---|---|---|---|---|
| 1 | 2 | 3 | 4 | |
| Interleukin-2 | −0.06 | 0.74 | −0.14 | 0.26 |
| Interleukin-6 | 0.95 | −0.04 | −0.10 | 0.03 |
| Interleukin-8 | 0.91 | 0.22 | 0.13 | −0.01 |
| Tumor necrosis factor-α | 0.25 | 0.62 | 0.03 | −0.34 |
| Granulocyte-macrophage colony stimulating factor | 0.00 | 0.84 | 0.11 | −0.02 |
| Interleukin-10 | 0.52 | 0.07 | 0.37 | −0.18 |
| Interleukin-1β | 0.55 | 0.37 | 0.00 | 0.50 |
| Interleukin-17 | −0.07 | −0.08 | 0.87 | 0.14 |
| Granulocyte colony-stimulating factor | 0.94 | −0.09 | −0.10 | 0.03 |
| Interleukin-21 | −0.02 | −0.01 | 0.15 | 0.86 |
| Interleukin-12/23p40 | 0.11 | 0.55 | 0.57 | 0.10 |

The variable obtained for Factor 1 showed positive correlation with the SOFA score on D1 (rho=0.25, p=0.04). Factor 3 was also correlated to SOFA D1 (rho=0.32, p=0.003). Factors 2 and 4 showed no correlation with the SOFA score.
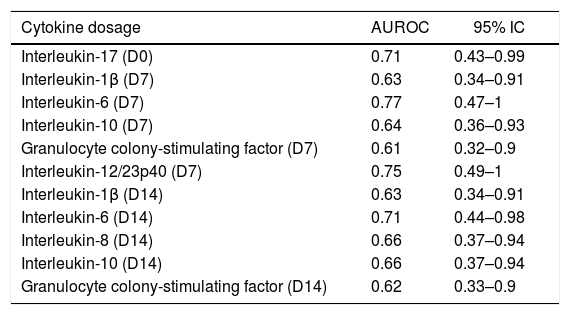
Sepsis and in-hospital mortality and cytokines concentrationIL-6 levels (D0) were higher in non-survivors (median=785pg/mL, IQR: 114.1–2980.6) than in survivors (median=133.7pg/mL, IQR: 40.2–293.3) (p=0.02). The same was true for IL-8, with higher levels in non-survivors (median=121.3pg/mL, IQR: 48.8–321) than in survivors (median=50pg/mL, IQR: 18.8–114.6) (p=0.01). Among the 11 cytokines evaluated over the three time-points, IL1-β, IL-6 and IL-10 on D7 and IL-1β, IL-6, IL-8, IL-10, G-CSF on D14 exhibited AUROC values above 0.6 for predicting hospital mortality. The cytokines that presented adequate accuracy to predict hospital mortality (AUROC >0.7) were IL-17 on D0, IL-6 and IL-12/23p40 on D7, and IL-6 on D14 (Table 4).
Accuracy of cytokines concentrations over the dosages to predict hospital mortality.
| Cytokine dosage | AUROC | 95% IC |
|---|---|---|
| Interleukin-17 (D0) | 0.71 | 0.43–0.99 |
| Interleukin-1β (D7) | 0.63 | 0.34–0.91 |
| Interleukin-6 (D7) | 0.77 | 0.47–1 |
| Interleukin-10 (D7) | 0.64 | 0.36–0.93 |
| Granulocyte colony-stimulating factor (D7) | 0.61 | 0.32–0.9 |
| Interleukin-12/23p40 (D7) | 0.75 | 0.49–1 |
| Interleukin-1β (D14) | 0.63 | 0.34–0.91 |
| Interleukin-6 (D14) | 0.71 | 0.44–0.98 |
| Interleukin-8 (D14) | 0.66 | 0.37–0.94 |
| Interleukin-10 (D14) | 0.66 | 0.37–0.94 |
| Granulocyte colony-stimulating factor (D14) | 0.62 | 0.33–0.9 |
In the mixed model analysis, IL-10 showed differences in the estimated means for the outcome in-hospital mortality (8.5pg/mL for survivors, 17.4pg/mL for the deceased, p: 0.014). IL-21 presented an estimated mean of 195.8pg/mL for the survivors and 98.5pg/mL for those who died in the hospital (p: 0.03). Fig. 2 shows the actual means of IL-10 (top) and IL-21 (down) observed in the measurements of the three time-points. There were no significant differences for the other cytokines
Discussion and IL-21 (down) (pg/mL, log scale) in survivors and deceased patient (in-hospital mortality).")
Sepsis has recently been redefined as a potentially lethal organ dysfunction caused by a dysregulated immune response to infection.12 The SOFA score (SOFA ≥2) was taken as a parameter to differentiate patients with infection from those with sepsis and high risk of death. In the present study, Th cell-related cytokines were evaluated in septic patients over the first 14 days of sepsis (D0, D7, D14) and compared to healthy volunteers. We demonstrated that the cytokines could be grouped according to their variance, which means their biological behavior over the three measurements during the period evaluated by the study, and that they also correlated with organ dysfunctions present not only at the time of admission (D0) but also on the following days (SOFA D1 and SOFA D3).
Our septic population presented higher plasma concentration of IL-6, IL-8, G-CSF, IL-10 on ICU admission (D0) than healthy volunteers. Sepsis immunopathogenesis has been characterized by an initial inflammatory response, triggered by the release of large amounts of inflammatory cytokines, followed by an anti-inflammatory response, with secretion of immunosuppressive mediators, monocyte deactivation, T lymphocyte anergy and apoptosis of immune cells.16,17 While inflammation leads to organ dysfunction and shock, the anti-inflammation increases susceptibility to secondary infection. This sequential model is challenged, however, to the evidence of the simultaneous release of inflammatory and anti-inflammatory responses, in a continuous process to reach balance and homeostasis.8 IL-6, IL-8, but also IL-10 baseline concentrations were associated with sepsis intensity and organ dysfunction progression.2 In an experimental model, Osuchowski et al. demonstrated simultaneously increased plasma levels of pro-inflammatory (IL-6, TNF, IL-1β, KC (CXCL1), MIP-2, MCP-1, and eotaxin) and anti-inflammatory (TNF soluble receptors, IL-10, IL-1 receptor antagonist) cytokines in mice dying from cecal ligation and puncture (days 1–5).18
The factor analysis performed in our study demonstrated the simultaneity of these processes, as it analyzed the time-shared variance between the different cytokines. Thus, observing the correlations of the measurement in three time-points, we realize that the most expressive inflammatory cytokines on the first day (IL-6, IL-8) are accompanied in time and variance by IL-10 production (Factor 1). IL-10 is a key immunoregulator during infection, modulating excessive Th1 response and CD8+ T cell responses, characterized by overproduction of IFN-γ and TNF-α.19 Besides that, IL-10 is produced by Treg lymphocytes regulating the Th17 inflammatory response. On the other hand, IL-6 is an essential cytokine for the differentiation of Th17 cells, and IL-8, although not a typical T helper cytokine, is also associated with the Th17 and Th1 cells differentiation inducing IL-17A and IFN-γ production.20
The individual analysis between cytokines and each organ dysfunction demonstrated that IL-8 plasma levels in D0 correlated with the development of renal and cardiovascular dysfunctions. IL-8 is associated with increased production of nitric oxide production and calcium homeostasis.21,22 Our observations supports in vivo what has been observed by Hoffmann et al. in cultures of mouse cardiomyocytes exposed to blood ultrafiltrates from septic patients: the ultrafiltrate rich in IL-1β, IL-8 and C3a induced a reduction in the frequency of contraction of cardiomyocytes when electrically stimulated.23 An important mechanism related to sepsis hypotension is the microvascular endothelial damage, which may be caused by bacterial products or direct viral action, and aggravated by inflammatory mediators such as cytokines, adhesion molecules, chemokines, and complement, among others.23 IL-8 binds to IL-8RA and IL-8RB receptors on the surface of neutrophils, and these activated receptors induce the expression of chemotactic mediators that trigger local inflammation. IL-8 was correlated with the development of acute renal injury in patients undergoing cardiac by-pass. One possible mechanism would be the attraction of neutrophils to the site of ischemic injury.24 In a model of ischemic renal injury (mice), treatment with an antibody to the IL-8 ligand protected against ischemia–reperfusion injury.22
We observed that G-CSF accompanies the variances of IL-6, IL-8, IL-1β and IL-10. G-CSF is a growth factor for the production of neutrophils, produced at the site of infection. Neutrophils are a key part of the inflammatory response, even when excessive and lead to tissue damage. The association between G-CSF and cardiovascular dysfunction presented in our study may be explained by neutrophils activation. In contrast, G-CSF is also an anti-inflammatory modulator, reducing inflammation by inhibiting the production and activity of IL-1β, TNF-α and IFN-γ.25,26
When analyzing the correlations between the cytokines factors and SOFA score, we observed that Factor 1 (IL-6, IL-8, IL-10, IL-1β and G-CSF) correlated with organ dysfunction progression, based on SOFA score within 24 (SOFA 0) and 72h (SOFA 3) of sepsis diagnosis. This result is supported by previous report showing that the concentrations of IL-6, IL-8, IL-10 and G-CSF in plasma were associated with organ dysfunction and the levels of IL-6, IL-8 and G-CSF in the first 24h were predictors of worsened dysfunction on the third day based in the delta (D3-D0) SOFA.27
The covariances between IL-2 and TNF-α can be explained by the fact that IL-2 induces the gene expression of TNF-α in monocytes and macrophages.28 TNF-α, in turn, is a potent inducer of GM-CSF, the other cytokine that shared variance in Factor 2 of our factor analysis model.29
IL-17 and IL-12/23p40 presented temporal correlation (Factor 3). We measured the subunit p40 that is shared between IL-12 and IL-23, so it was not possible to discriminate the individual contribution of each of these cytokines in our study. IL-12 induces the differentiation of naïve CD4+ cells in Th1 thus producing interferon (IFN-γ).30 IL-23 induces IL-17 once IL-23 receptors are expressed by various lymphoid cells of the innate and adaptive systems, including γδT, iNKT, NKp46, lymphoid tissue inducer cells, and Th17, with prompt secretion of IL-17 in response to the antigenic stimulus.31 IL-23 is not related to the differentiation of Th17 from naive cells, but is relevant for the clonal expansion of these lymphocytes and production of IL-17.32
In the present study, IL-12/23p40 showed higher plasma concentrations in healthy volunteers than in septic patients (D0). This finding is in line with a previous report from our group that evaluated neutropenic patients with sepsis and compared with a non-septic neutropenic group showing that the IL-23 plasma concentration was significantly lower in the septic patients, suggesting a repression of this axis on sepsis.33 Reduced levels of IL-23 mRNA were previously reported in septic patients compared to healthy volunteers, further supporting the detection of lower protein concentrations in our cohort.34
The Factor 3, composed by the Th17 cytokines IL-17 and IL-12/23p40, correlated with SOFA on D0 and within 24h (D1). These cytokines are eminently inflammatory and are associated with organ dysfunction in sepsis. Guo et al. found that septic patients with multiple organ dysfunction syndrome (MODS) presented higher levels of Th17 cytokines, IL-17 and IL-23, compared to no-MODS group.35 Sepsis is associated with an increased proportion of Th17 lymphocytes and the more exacerbated is the inflammatory response, the more adverse the outcome and organ dysfunctions by the SOFA score.7
IL-21 (Factor 4), which is synthesized by several CD4+ and some CD8+ T cell lines under appropriate conditions did not significantly shared variance with the other evaluated cytokines. IL-21 is essential for the Th cells differentiation and amplification of the Th17 response.36 This cytokine is strongly associated with inflammation and exerts inhibitory effects on Treg and B cells reducing IL-10 production.37 Despite the association with Th17 inflammatory response, IL-21 did not vary according to other th17 cytokines evaluated and was grouped in a factor different from IL-17 and IL-12/23p40 (Factor 3).
Interestingly, the Factor 4, composed only by IL-21, showed a negative correlation with SOFA score, which suggests that it is a protective factor for organ dysfunction in sepsis. Paidipally et al. demonstrated, in an experimental model with Mycobacterium tuberculosis stimulated CD4+ and NK T cells, that Interleukin-21 activated NK cells, and also enhances the immune response by augmenting IL-1β, IL-18, and MIP-1β production, and reducing IL-10 production by monocytes in response to an intracellular pathogen.38 IL-21 is related to the more effective combat of the pathogen and perhaps this is associated to a better outcome in sepsis, with less organic dysfunction and lower mortality.
Finally, in the mixed model analysis, we observed higher estimated concentrations of IL-10 in patients who died in hospital and higher IL-21 levels in those who survived, thus reinforcing their role in immunomodulation in sepsis. As pointed out above, IL-10 can directly regulate the innate and adaptive responses, limiting the activation of T cells and differentiation in the lymph nodes, in addition to suppressing the pro-inflammatory activity in tissues, leading to difficulty in controlling pathogens.39,19 Higher mean levels in non-survivors seem to indicate that, in this group, there was an imbalance in favor of immunosuppression, with impact on outcome. In contrast, survivors presented higher levels of IL-21, a truly pleiotropic cytokine with immune stimulatory properties on both innate and adaptive immunity would suggest a balance preserving immune function.40,41
Our study has strengths and limitations. First, the small sample size limits the extent to which our findings may be generalized to other groups of patients. Second, only three time-points were used for cytokines measurements. Some cytokines, whose peak of action occurs within a few hours, such as TNF-α and IL-1β, may have had their evaluation impaired, explaining the similarity of the values observed in healthy controls and patients.
ConclusionsPlasma levels of cytokines encompassing Th1, Th2 and Th17 profiles showed that inflammatory and anti-inflammatory cytokines shared co-variance in septic patients and were related with organ dysfunctions and in-hospital mortality.
FundingThis research was supported by FAPESP (Fundação de Amparo à Pesquisa do Estado de São Paulo – Grant 2011/20401-4).
Conflicts of interestThe authors declare no conflicts of interest.
