

Excessive weight gain is a current concern among People Living with HIV (PLHIV) starting ART.
ObjectivesTo evaluate the weight gain after 48-weeks of ART in naive patients, according with baseline CD4 count.
MethodsPLHIV starting 3TC + TDF + DTG with at least 48-weeks of follow up in two AIDS referral centers were stratified by baseline CD4 count (lower or higher than 200 cells/mm3). Data on CD4 count, HIV viral load, weight/Body Mass Index (BMI), lipids and glucose levels were collected at baseline, 24 and 48 weeks of treatment. For analysis purpose, patients were categorized according to their BMI progression.
ResultsA total of 270 patients were included in the study. Mean CD4 count were 78.3 ± 61.7 and 536.7 ± 273 cells/mm3 for low and high CD4 count groups, respectively (p < 0.001). Baseline BMI was significantly lower in low CD4 group (21.7 vs. 23.6 Kg/m2, p < 0.001). Patients in low CD4 group gained more weight than those in high CD4 group (11.2 ± 8.5 kg vs. 2.2 ± 4.2 Kg, p = 0.004). Overall weight gain was higher in women, regardless group (13.1 ± 7.9 Kg vs. 1.4 ± 3.6 Kg for women and men, respectively, p < 0.001). The proportion of overweight/obesity significantly increased in low CD4 group. Viral suppression rate was high for both groups. At week 48 the overall proportion of overweight/obesity was like that reported for the Brazilian population.
ConclusionsWeight gain in the present study indicates a “return to health” phenomenon. Excessive weight gain was more frequent in women.
The evolution of antiretroviral therapy in last decades provided a long-term viral suppression, that translates into higher quality of life, longer life expectancy and an impressive decrease in the burden of HIV-associated health problems for People Living with HIV (PLHIV). Dolutegravir (DTG) an integrase single-strand transfer inhibitor is recommended as the base of first-line Antiretroviral Therapy (ART) by most of international guidelines, because its potent antiviral activity, tolerability, and convenience (EACS, DHHS, WHO).1–3 However, recent studies showed that DTG-based regimens were associated with a greater weight gain than regimens based in other antiretroviral drugs.4–6
Several studies have investigated the relationship between Dolutegravir use and weight gain in PLHIV. In a large observational cohort study that included over 1000 PLHIV, researchers found that those who started DTG-based ART had a greater increase in weight than those who started other ART regimens. Specifically, patients on DTG-based therapy gained an average of 6.0 kg over the first 18 months of treatment, compared to an average gain of 2.6 kg in patients on Non-Nucleoside Reverse Transcriptase Inhibitors (NNRTI) regimens.4
A recent network meta-analysis showed that DTG in combination with Tenofovir Alafenamide (TAF) and lamivudine or emtricitabine (XTC) was associated with a higher increase in weight gain compared with regimens that used DTG with other Nucleoside Reverse Transcriptase Inhibitors (NRTI) as a backbone. In addition, DTG was associated with a higher weight gain than NNRTI and a weight increase comparable to that observed in raltegravir or bictegravir, other commonly used INSTI.5 The role of other NRTI (like Tenofovir Disoproxil Fumarate – TDF, or Abacavir – ABC) is not clear, although a recent report showed that naïve PLHIV on ART regimens containing DTG plus TDF/FTC or TAF/FTC were at higher risk of weight gain increase.6
Other factors have been associated to weight gain in patients starting ART, like female sex and low CD4 count at baseline.7,8 The dimension of this problem is still controversial, with some studies suggesting that weight gain is only a result of the return to a healthy status, following ART initiation, while others indicate that excessive weight gain could result in metabolic problems and a higher risk of non-AIDS related problems.9–11 However, the methodological diversity of the available studies makes difficult to define the role of each of these variables on the weight changes in real life world.
We aimed to evaluate the weight gain in PLHIV starting therapy with a combination of 3TC+TDF+DTG after one year of follow-up, according to their baseline CD4 count (higher or lower than 200 cells/mm3).
MethodsStudy design and sample size calculationThis is a retrospective, observational cohort study that compared weight gain among patients who started DTG-based ART (lamivudine/TDF+DTG) during the period of 2020‒2022 at two AIDS care referral centers, in Salvador, Brazil, who completed at least 48 weeks of follow up. Patients were stratified by baseline CD4 count (higher or lower than 200 cells/mm3). To calculate sample size, we considered that 10% of patients with a higher CD4 count would present a significant weight gain, compared to 24% of those with a lower CD4 count. Considering a confidence interval of 95% and a power of 80% we would need 126 patients in each arm. We added 10% more subjects to account for data loss, totalizing 135 per arm.
Patients and settingsWe included in the study 270 patients who started ART at the AIDS clinics of Federal University of Bahia Hospital (HUPES), and the Marymar Novais Clinic, two referral centers for AIDS care in Salvador, state´s capital. All eligible patients attending the clinic during the study period were invited, and consecutively included in the study until completion of the sample. Inclusion criteria were confirmed HIV infection, ART initiation during the study period with at least 48 weeks of regular follow up after starting therapy, availability of recorded data on weight, fasting glucose and lipids levels, HIV-1 RNA plasma viral load and CD4/CD8 count at each time point.
Study proceduresMedical charts were reviewed at the two HIV care referral centers. All patients attending regular medical visits and fulfilling the inclusion criteria were invited to participate in the study and consecutively included until the required sample size was reached.
Ethical considerationsThe study was conducted according to the Declaration of Helsinki. The study was approved by the ethical committee of Maternidade Climério de Oliveira, at Federal University of Bahia (number CAAE: 42996315.9.0000.5577).
Statistical analysisFor analysis purpose patients were classified into 5 categories of BMI status change for the evaluation at the three time points: those who 1) Were classified as “Underweight” (BMI < 18) at baseline and did not change BMI status throughout the study period, 2) Changed their BMI status from “underweight” to “healthy weight” (BMI between 18 and 25), 3) Remained as “healthy weight” throughout the study, 4) Changed from healthy weight to overweight (BMI higher than 25 and lower than 30) or “obese” (BMI > 30) and 5) Stayed overweight or obese up to the end of the study (week 48). The lipid classification (total cholesterol, LDL and HDL cholesterol, Triglycerides) followed The National Cholesterol Education Program Adult Treatment Panel III guidelines (NCEP).12
Statistical analysis was performed using SPSS version 18.0 software (SPSS, IBM). Categorical variables were expressed as absolute and relative frequencies and continuous variables as mean and Standard Deviation (SD) or median and Interquartile Range (IQR), as appropriate. Categorical variables were evaluated by the Chi-Square test, and continuous variables were compared by the Mann-Whitney test (for two groups) and the Kruskal-Wallis test (for more than two groups). The Cochran Q test was used to compare the proportion of individuals with high lipid levels at the three study timepoints (Baseline; week 24 and week 48). Probability values of < 0.05 were considered as statistically significant.
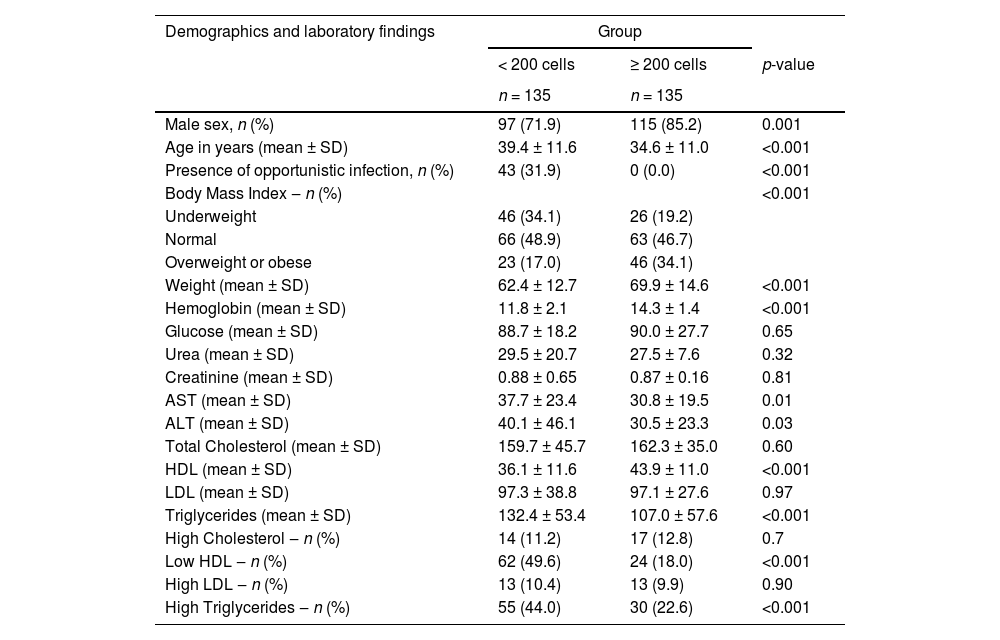
ResultsA total of 270 patients were included in the study, 135 per arm, predominantly (78.5%) males, but with a significant higher proportion of females in the low CD4 group (28.1% vs. 14.8% for low and high CD4 groups, respectively, p < 0.01). Patients with a low CD4 count were older (39.4 ± 11.6 years vs. 34.6 ± 11.0 years, for low and high CD4 count groups, respectively, p < 0.001), and had a significantly lower (21.7 vs. 23.6, p < 0.001) Body Mass Index (BMI) than those in high CD4 group. Mean baseline viral load was significantly higher (4.16 ± 7.19 log10 vs. 1.03±1.66 log10 copies/mL, p < 0.001) for the group with CD4 < 200 cells. Mean CD4 cells count was 78.3 ± 61.7 and 536.7 ± 273 cells/mm3 for low and high CD4 count groups (p < 0.001). Viral suppression rate was similar for both groups at 48 weeks of follow up (94.8% and 96.3% for lower and higher CD4 groups, respectively, p = 0.58). Table 1 summarizes the main characteristics of patients at baseline.
Baseline characteristics of patients at diagnosis of HIV infection according to their initial CD4 count (less than or equal or more than 200 cells/mm3).
SD, Standard Deviation; LDL, Low Density Cholesterol; HLD, High Density Cholesterol.
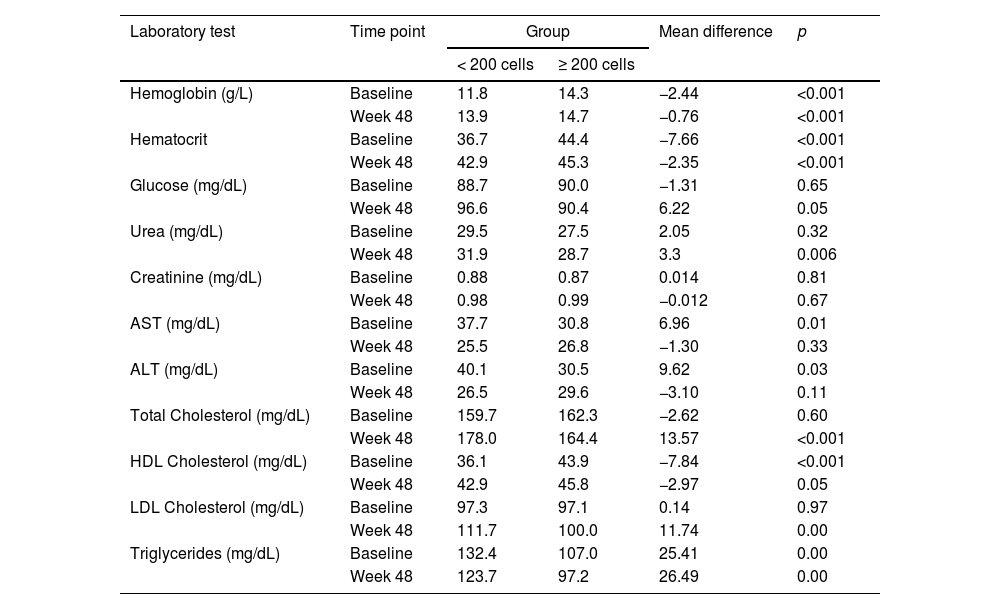
There were significant differences in the levels of hemoglobin, ALT, AST, HDL cholesterol, LDL cholesterol and triglycerides between groups at baseline. After 48 weeks, lipids levels remained significantly higher in low CD4 group. Fasting glucose levels were similar for both groups. Table 2 shows the values for laboratory tests at baseline, 24 and 48 weeks of follow-up.
Laboratory values at baseline and at 48 weeks of follow up, according to CD4 group.
The mean weight gain (11.2 ± 8.5 kg) in low CD4 group was significantly higher than that observed in high CD4 group (2.2 ± 4.2 Kg, p = 0.004). At week 48 the weight gain was higher for women, regardless group (13.1 ± 7.9 Kg vs. 1.4 ± 3.6 Kg for low and high CD4 groups, respectively, p < 0.01) in comparison to men (10.4 ± 8.7 Kg vs. 2.3 ± 4.3 Kg, for low and high CD4 groups, respectively, p < 0.001). However, the difference in weight gain by sex was not significant for individuals in the same group (2.7 Kg for low CD4 group, p = 0.09, and 0.9 Kg for the high CD4 group, p = 0.39). A multivariate analysis showed a significant association between lower baseline CD4, female sex, and lower hemoglobin level at baseline and weight gain (Table 3). Lower weight at baseline was predictive of lower weight gain.
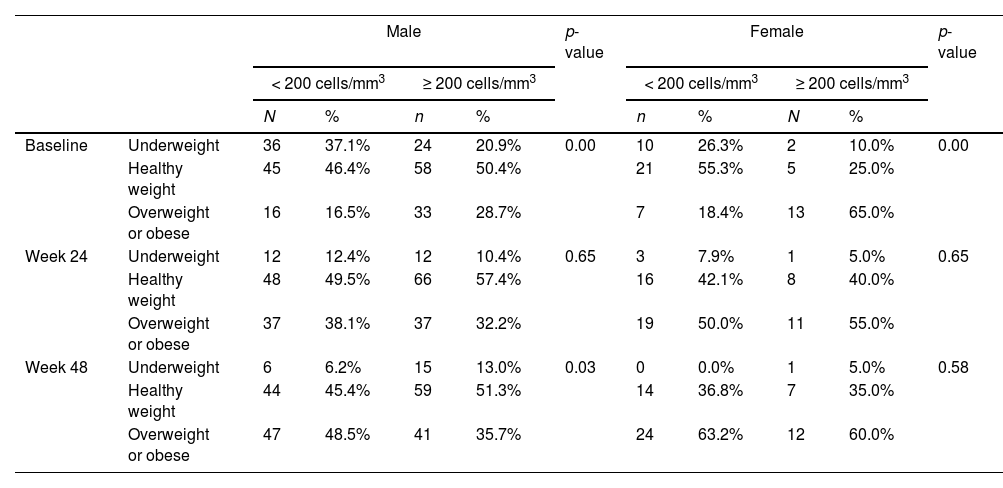
Number of patients by BMI classification at day zero and Week 48 by gender at birth and number of CD4 cells.
p, For linear trend of BMI classification for participants within each CD4 cells group.
BMI values were significantly different for low and high CD4 groups at baseline, as expected, but it increased overtime in low CD4 group, equaling high CD4 group at 6 months and showing a significantly higher value at 12-months. The variation between BMI was different by group and sex, with a progressive increase in BMI for patients in low CD4 group, which was even higher for women, in comparison to men. However, in high CD4 group we observed an inverse variation, with a slightly increase in BMI for men and a decrease in the overall proportion of overweighted patients (Table 3).
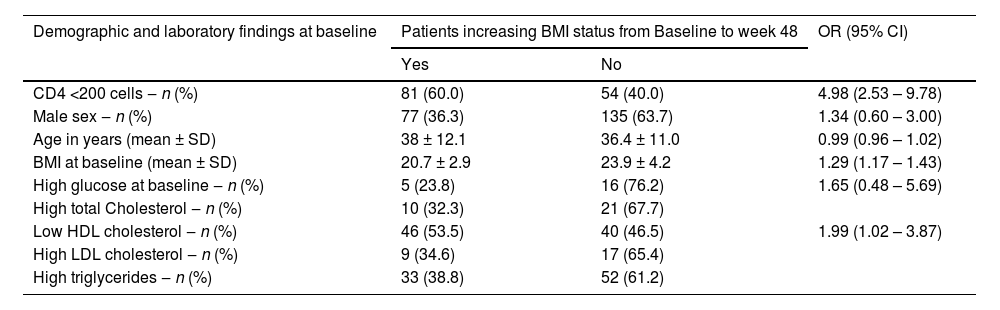
The pattern of weight gain was different by groups: in low CD4 group the proportion of obesity at baseline was similar for men (16.5%) and women (18.4%), but at 6 months it increased to 38.1% among men and 50% among women, reaching even higher levels at 48 weeks, when 48.5% of men were classified as obese, versus 63.2% of women (p < 0.001 for comparison to baseline at both timepoints, for both groups). In contrast, in the high CD4 group there was a minor BMI increase for men (progression from 28.7% of obesity at baseline to 32.2% at 24 weeks, and 35.7% at 48 weeks) and a similar decrease in the proportion of obesity among women (65% at baseline, compared to 55% and 60.0% at 24 and 48 weeks, respectively). The evolution of BMI by group and sex is shown in Fig. 1. In a multivariate analysis only low HDL cholesterol, low CD4 and low BMI at baseline remained significantly associated with excessive weight gain (Table 4).

Multivariate analysis of risk factors to increasing the initial BMI category after 48 weeks.
SD, Standard Deviation; LDL, Low Density Cholesterol; HDL, High Density Cholesterol.
Note: Logistic regression was performed for variables with p<0.30 and included the variables: male gender at birth; age in years; BMI at day zero; high glucose; low HDL cholesterol.
To evaluate the potential clinical impact of lipids variation during the study period we looked at the frequency of total cholesterol and LDL cholesterol above the normal range limits, as well as the proportion of patients with HDL cholesterol below the normal range limits. At baseline, the proportion of low HDL cholesterol and high triglycerides levels were significantly different in low CD4 group, compared to the high CD4 one. However, the difference in low HDL vanished overtime, while patients in low CD4 group presented a significantly higher total cholesterol at 6 and 12 months. Triglycerides levels remained significantly higher at 6 and 12 months (Table 2). Mean fasting glucose levels also increased overtime in low CD4 group (from 88.7 mg/dL at baseline to 96.6 mg/dL at week 48) but remained stable among patients in high CD4 group (from 90.0 mg/dL at baseline to 90.4 mg/dL at week 48).
DiscussionIn this retrospective, observational cohort, we evaluated the weight gain in 270 PLHIV stratified by baseline CD4 cells count (higher or lower than 200 cells/mm3) who started antiretroviral therapy with Lamivudine/TDF+DTG, after 48 weeks of follow up, in Salvador Brazil. Weight gain was significantly associated with low CD4 count at baseline, and female sex. Mean weight gain was higher in low CD4 group, as well as the proportion of patients progressing to overweight or obesity in comparison to the high CD4 group, suggesting that the difference in weight gain represents a “return to health” phenomenon. This conclusion is reinforced by the finding that the proportion of overweight/obese patients at 48 weeks was like that reported for the Brazilian population.13
In most studies on weight gain during ART women were more likely to increase weight than men. In the present report, we found the same characteristic, but it was restricted to low CD4 group. In the high CD4 group, the proportion of overweight/obese patients was high at baseline and persisted unchanged during the study. The increase in obesity from baseline to week 48 was detected only in men, while there was a decrease in the proportion of overweight/obese women in the same period. The proportion of overweight/obese patients in the high CD4 group is like that reported in general population and probably reflects lifestyle characteristics, rather than a change induced by ART.13
Use of INSTI or tenofovir alafenamide was associated with excessive weight gain in several studies that included patients switching to or starting ART regimens based on these drugs, but other antiretrovirals like bictegravir and ritonavir-boosted darunavir were also associated with higher weight gain.14,10,15,16 In the present work, we used a combination of Lamivudine/TDF+DTG, the first-line recommendation for starting ART in Brazil.17 The use of a single ART regimen for all patients made it possible to better evaluate other factors related to weight gain in such populations.
The proportion of patients progressing from healthy weight at baseline to overweight/obesity at 48 weeks was significantly different between groups with a mean 15.8 ± 7.5 Kg weight increase for patients in the low CD4 group versus 5.3 ± 3.1 in the high CD4 group (p < 0.001). In addition, women progressing to overweight/obesity showed a mean weight gain of 17.2 ± 6.9 Kg, in comparison to a mean weight gain of 12.3 ± 8.1 for men that also progressed to overweight/obesity category (p = 0.01). However, the mean weight gain was similar for both sexes in all other weight categories. A significantly higher proportion of patients in the low CD4 count progressed from underweight to healthy weight, or from healthy weight to overweight/obesity, in comparison to the high CD4 group. In addition, the frequency of patients remaining in healthy weight or in overweight/obese categories from baseline to week 48 was significantly higher in the high CD4 group, as shown in Table 3. The mobility between weight categories was more evident in the low CD4 group, and did not differ by sex, reinforcing the evidence of a return to health phenomenon. Taramasso et al. also detected an association between low baseline CD4 count and higher weight gain. On the other hand, they also detected a protective effect of female sex and higher weight at baseline. However, the studied population was composed basically (91%) of Caucasian people, which sharply contrasts with our sample.18
In the ADVANCE study the findings on an excessive weight gain predominantly detected in women suggested a sex-related factor, but life-style characteristics were also discussed as a potential cause of weight gain.19 Our findings demonstrate that the weight gain is a likely reflex of initial disease stage, as the greater the immunosuppression the greater was the weight gain. In addition, the proportion of overweight/obese patients in the high CD4 group remained unchanged from baseline to week 48. Moreover, it was like that observed in general population: according to a recent report from Brazilian Ministry of Health, 60.3% of the Brazilian population were considered overweighted/obese, which is consistent with our results, reinforcing the evidence that weight gain in the low CD4 group was a return of health phenomenon. An observational study with 329 patients concluded that weight gain is a common finding in all patients starting ART and reinforce the initial stage of disease and use of TAF as factors driving the weight changes.8 In a review of risk factors for weight gain in clinical trials, Sax et al. emphasize that weight gain is ubiquitous in ART initiation clinical trials and is multifactorial in nature, but the mechanisms by certain drugs contribute to weight gain are still unknown.20
The changes in BMI did not seem to increase the metabolic disease risk for the study population, despite the significant increase in the levels of total cholesterol, and LDL cholesterol, for the low CD4 group. At week 48, triglycerides decreased since baseline, while total cholesterol and LDL cholesterol were higher than normal limits levels in almost 50% of low CD4 group. Mean glucose levels also increased but remained in the normal range.
Our work has some limitations like the absence of information on body fat distribution, the lower proportion of women, and a limited number of sites included in the study. However, the sample was large enough to provide a clear view of the differences in weight gain for two well characterized groups of patients, in two referral centers for AIDS care. In addition, the use of same ART regimen gave us the opportunity to better explore the questions related to sex and immunosuppression, and to define the main clinical factors associated with weight change in PLHIV starting ART.
Our results provide consistent evidence that weight changes in PLHIV starting ART is a return to health phenomenon, driven basically by baseline CD4 cells count. Although the mean overall weight gain was significantly higher in women, it did not differ when we look at the difference by CD4 group, which also indicates a return to health pattern. Moreover, the proportion of overweight/obese women in the high CD4 group was like that observed for women at similar social characteristics, but without HIV infection.13 In this context, the role of ART drugs as a causal factor in weight gain seems to be less important than such characteristics. Educational interventions focusing on a healthy lifestyle can help healthcare providers in the management of such problems in PLHIV.
The present work received no funding.
