

To identify lipodystrophy in prepubertal HIV-infected children using anthropometric parameters and body composition assessment.
MethodsCross-sectional study including 40 prepubertal HIV-infected children of both genders seen at the Care Center of the Division of Pediatric Infectious Diseases – Universidade Federal de São Paulo, São Paulo city, Brazil, was carried out from August to December 2008. Age, clinical and immunological status, prophylaxis, transmission and highly active antiretroviral therapy were recorded. Body mass index z-score and height-for-age z-score were calculated to characterize the nutritional status. Circumferences were measured with flexible tape and skinfolds were assessed by an adipometry. Fat mass and lean mass were determined by dual-energy X-ray absorptiometry. Presence of clinical signs of lipodystrophy was assessed by a trained clinician. Data were analyzed using SPSS 12.0 software.
ResultsThe mean age and standard deviation were 9.8 (1.2) years, 50% were girls and 82.5% children from B and C categories. Clinical lipodystrophy and dislypidemia were present in 27.5% and 70%, respectively. The trunk to arm ratio and the limb to trunk ratio had positive association with lipodystrophy. Patients with lipodystrophy had short stature, higher triglycerides values and lower HDL-cholesterol.
ConclusionThe ratios obtained by skinfolds and dual-energy X-ray absorptiometry measurements can be considered as indicators of preclinical lipodystrophy. The cutoff points have not been determined yet; however, continuous assessment may be useful to identify early body composition changes.
The highly active antiretroviral therapy (HAART) has significantly reduced morbidity and mortality in HIV-infected children. A U.S. multicenter study showed that, between 1994 and 2000, the death rate decreased from 7.2 to 0.8 per 100 children/year, remaining stable until 2006.1 In Brazil, probability of survival to 60 months has increased from 52.8% among children diagnosed during the period between 1983 and 1998 to 86.3% among children born from 1999 to 2007.2 Assuredly, in addition to preserve or restore the immune system, the use of HAART also contributes to maintain or improve weight for height growth.3
Nonetheless, HIV infection itself and the use of antiretroviral therapy cause clinical and metabolic changes initially described in adults in the late 90s4 and subsequently observed in children and adolescents.5 Due to precocity and large exposure to the drug, especially in infections acquired by vertical transmission, this population shows higher risks of developing adverse effects of antiretroviral therapy.5
Among other metabolic side effects of antiretroviral therapy, we mention the lipodystrophy syndrome, which comprises lipodystrophy, dyslipidemia, insulin resistance and cardiovascular risk.6 Lipodystrophy is identified and characterized by the use of clinical parameters, which causes several difficulties.7,8 Anthropometric measurements and assessment of body composition are useful instruments to monitor the evolution of growth, also being useful to identify the presence of clinical and metabolic changes.9 Therefore, this study aims to identify lipodystrophy in prepubertal HIV-infected children through anthropometric measurements and body composition assessments.
MethodsWe carried out a cross sectional study with 52 prepubertal children (7–12 years old), both genders, seen at the Care Center of the Division of Pediatric Infectious Diseases (CEADIPe) of the Department of Pediatrics of UNIFESP/EPM from August to November 2008. Children with genetic syndrome or neuropathy were not included. One hospitalized patient died, five had neuropathy and six were not allowed by the caregiver to participate in the study. Thus, the final sample totaled 40 patients. The study was approved by the Research Ethics Committee of the Universidade Federal de São Paulo and initiated upon consent in writing of parents or guardians.
Pubertal stage was assessed by the pediatrician, who used, as a criterion, the development of the secondary sexual characteristics proposed by Marshall and Tanner,10 including the study children and adolescents who showed staging.1 In order to classify the disease, we used the clinical parameters and immunological categories proposed by the Ministry of Health,3 which adopted the guidelines from the Centers for Disease Control and Prevention (CDC),11 in addition to inclusion of pulmonary tuberculosis as a criterion in clinical category B.
Data on identification, age, type of transmission, prophylaxis, patient's legal caregiver and/or guardian and antiretroviral regimen were collected from the medical records of these patients. Clinical lipodystrophy was clinically identified by the pediatrician, showing three characterizations: lipoatrophy, lipohypertrophy and mixed lipodystrophy.12
Weight and height measurements were used to calculate the body mass index z-score (zBMI) and height-for-age z-score (HAz), pursuant to the reference standard and recommendation of the World Health Organization.13 Skinfolds were measured by using an adipometer under the brand Lange® (Beta Technology Inc., Santa Cruz, CA, USA) with precision of 1mm, and circumferences were measured with a flexible, non-extendable tape graduated in 0.1-cm. Trunk to arm ratio was calculated through the sum of the subscapular and suprailiac skinfold divided by the value resulting from the sum of biceps and triceps skinfolds.12 Body composition was assessed through dual-energy X-ray absorptiometry (DXA) by only one trained technician (equipment LUNAR™ DPX-L, pediatric software, version 1.5). The ratio limb to trunk was obtained by adding the fat (g) in arms and legs and dividing it by the fat value (g) in trunk.
HIV viral load was determined through the RT-PCR technique (Cobas Amplicor HIV-1 Monitor™ Test, version 1.5) and T CD4 and T CD8 lymphocytes were assessed through flow cytometry (BD FACSCalibur™ System). The lipid profile was determined through reflectance spectrophotometry – colorimetry – 540nm (Vitros Systems Chemistry 750 XRC – Ortho-Clinical Diagnostics, Inc. – Johnson & Johnson Company, New York, NY, USA), using the cutoffs proposed by Kwiterovich.14 Blood glucose was measured through the enzymatic method using hexokinase and glucose-6-phosphate dehydrogenase enzyme (Advia Chemistry System 1650 – Bayer) and insulin through an immunoenzymatic method (Tosoh–Tosoh Corporation, Tokyo, Japan). Fasting insulin and blood glucose were used to calculate the homeostatic model assessment-insulin resistance (HOMA-IR), which characterizes insulin resistance when HOMA-IR>3.15 Skeletal muscle mass was calculated pursuant to Heymsfield et al.16
For statistical analysis, we used the Statistical Package for the Social Sciences (SPSS) program version 12.0. To compare qualitative variables, we used the Chi-square test or Fisher's Exact test. To compare quantitative variables, we used Student's t-distribution test. Shapiro–Wilk test was used to assess the normality of continuous quantitative variables. Those showing no regular distribution were transformed into logarithm (log10) for the statistical tests. We computed the Pearson's correlation coefficient in order to show the degree of linear correlation between the variables. A linear regression model was prepared to investigate the determinants of lipodystrophy. The trunk to arm ratio was used as a dependent variable. A correlation matrix was developed, provided that the entry in the model followed the ascending order with value p<0.20. The variables that adjusted the model and remained significant were maintained in the final model. Values of p<0.05 were deemed significant.
ResultsIn this study, the final sample comprised 40 prepubertal children, where 50% of the sample were female, with an average age and age standard deviation of 9.8±1.2 years. HIV infection occurred through vertical transmission in 39 (97.5%) of the prepubertal children, provided that 23 (56.4%) did not receive any type of prophylaxis during the gestational and perinatal stage and the first months of life. With respect to clinical and immunological classification, 33 (82.5%) were linked to clinical parameters B and C and 16 (40%) to immunological classification 3. Clinical lipodystrophy was identified in 11 (27.5%, IC 95%: 14.6–43.9) patients, three (7.5%) characterized as lipohypertrophy, four (10%) as lipoatrophy and four (10%) as mixed lipodystrophy. Antiretroviral therapy combined with three drugs was used by 30 (75%) study patients and 21 of them (52.5%) used therapeutic regimen with protease inhibitor (PI). Time of exposure to antiretroviral therapy in this population was 7.8±2.4 years. As for the nutritional condition, 33 (82.5%) were eutrophic, 6 (15%) overweight/obese and 34 (85%) showed proper height. The prevalence of dyslipidemia in the study population was 70% (28 children). Regarding metabolic changes, 16 patients (40%) showed hypertriglyceridemia, 13 (32.5%) hypercholesterolemia, 13 (32.5%) a decrease in HDL cholesterol serum levels and 7 (17.5) an increase in LDL cholesterol serum levels. Insulin resistance was found in 1 (2.5%) patient.
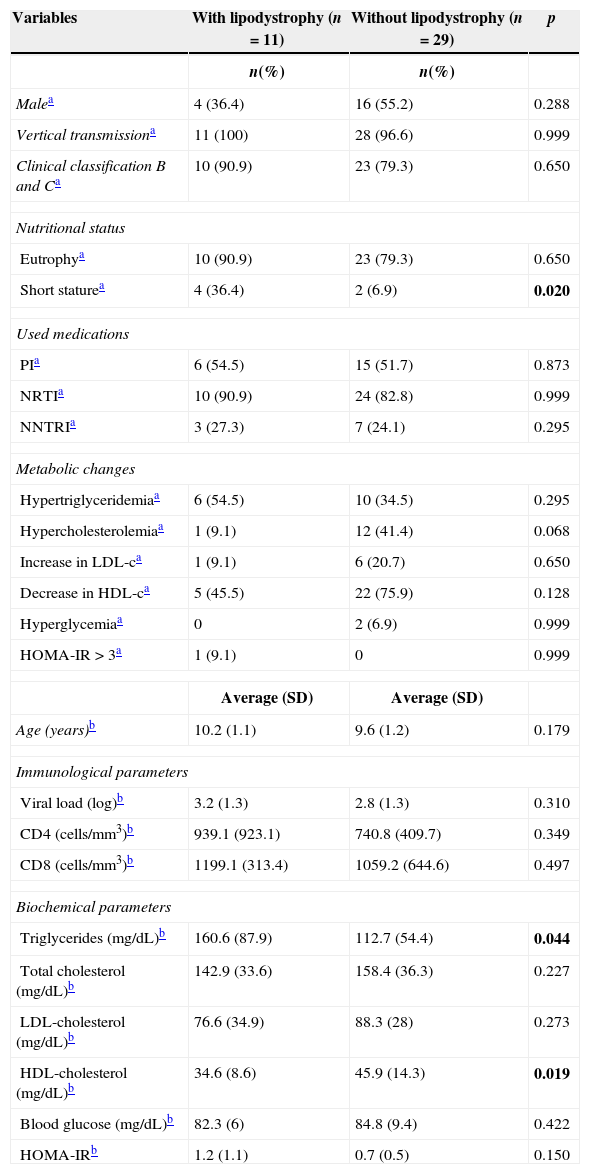
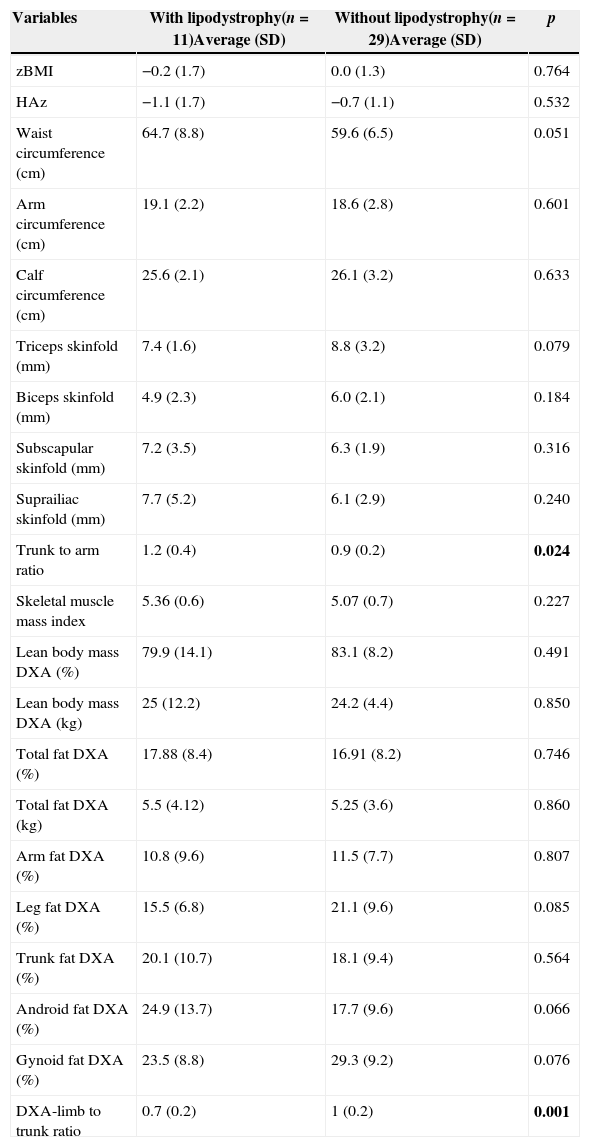
In Table 1, we compared clinical variables and immunological and laboratory parameters of patients in the presence or absence of lipodystrophy. The trunk to arm ratio, obtained through skinfolds, showed a strong association with the presence of lipodystrophy, as well as the ratio limb to trunk determined through DXA (Table 2). When correlated, these variables showed a moderate negative correlation (r=−0.69; p=0.000) (Fig. 1).
Characterization, nutritional status, antiretroviral drug, metabolic changes and immunological and biochemical parameters of HIV-infected prepubertal children with and without lipodystrophy.
| Variables | With lipodystrophy (n=11) | Without lipodystrophy (n=29) | p |
|---|---|---|---|
| n(%) | n(%) | ||
| Malea | 4 (36.4) | 16 (55.2) | 0.288 |
| Vertical transmissiona | 11 (100) | 28 (96.6) | 0.999 |
| Clinical classification B and Ca | 10 (90.9) | 23 (79.3) | 0.650 |
| Nutritional status | |||
| Eutrophya | 10 (90.9) | 23 (79.3) | 0.650 |
| Short staturea | 4 (36.4) | 2 (6.9) | 0.020 |
| Used medications | |||
| PIa | 6 (54.5) | 15 (51.7) | 0.873 |
| NRTIa | 10 (90.9) | 24 (82.8) | 0.999 |
| NNTRIa | 3 (27.3) | 7 (24.1) | 0.295 |
| Metabolic changes | |||
| Hypertriglyceridemiaa | 6 (54.5) | 10 (34.5) | 0.295 |
| Hypercholesterolemiaa | 1 (9.1) | 12 (41.4) | 0.068 |
| Increase in LDL-ca | 1 (9.1) | 6 (20.7) | 0.650 |
| Decrease in HDL-ca | 5 (45.5) | 22 (75.9) | 0.128 |
| Hyperglycemiaa | 0 | 2 (6.9) | 0.999 |
| HOMA-IR>3a | 1 (9.1) | 0 | 0.999 |
| Average (SD) | Average (SD) | ||
| Age (years)b | 10.2 (1.1) | 9.6 (1.2) | 0.179 |
| Immunological parameters | |||
| Viral load (log)b | 3.2 (1.3) | 2.8 (1.3) | 0.310 |
| CD4 (cells/mm3)b | 939.1 (923.1) | 740.8 (409.7) | 0.349 |
| CD8 (cells/mm3)b | 1199.1 (313.4) | 1059.2 (644.6) | 0.497 |
| Biochemical parameters | |||
| Triglycerides (mg/dL)b | 160.6 (87.9) | 112.7 (54.4) | 0.044 |
| Total cholesterol (mg/dL)b | 142.9 (33.6) | 158.4 (36.3) | 0.227 |
| LDL-cholesterol (mg/dL)b | 76.6 (34.9) | 88.3 (28) | 0.273 |
| HDL-cholesterol (mg/dL)b | 34.6 (8.6) | 45.9 (14.3) | 0.019 |
| Blood glucose (mg/dL)b | 82.3 (6) | 84.8 (9.4) | 0.422 |
| HOMA-IRb | 1.2 (1.1) | 0.7 (0.5) | 0.150 |
HOMA-IR, homeostatic model assessment-insulin resistance; NRTI, nucleoside reverse transcriptase inhibitors; NNRTI, non-nucleoside reverse transcriptase inhibitors; PI, protease inhibitors. Bold values mean the values that presented statistical difference.
Average and standard deviation of anthropometric measures/indexes and fat percentage (%) assessed through DXA of prepubertal HIV-infected children with and without lipodystrophy.
| Variables | With lipodystrophy(n=11)Average (SD) | Without lipodystrophy(n=29)Average (SD) | p |
|---|---|---|---|
| zBMI | −0.2 (1.7) | 0.0 (1.3) | 0.764 |
| HAz | −1.1 (1.7) | −0.7 (1.1) | 0.532 |
| Waist circumference (cm) | 64.7 (8.8) | 59.6 (6.5) | 0.051 |
| Arm circumference (cm) | 19.1 (2.2) | 18.6 (2.8) | 0.601 |
| Calf circumference (cm) | 25.6 (2.1) | 26.1 (3.2) | 0.633 |
| Triceps skinfold (mm) | 7.4 (1.6) | 8.8 (3.2) | 0.079 |
| Biceps skinfold (mm) | 4.9 (2.3) | 6.0 (2.1) | 0.184 |
| Subscapular skinfold (mm) | 7.2 (3.5) | 6.3 (1.9) | 0.316 |
| Suprailiac skinfold (mm) | 7.7 (5.2) | 6.1 (2.9) | 0.240 |
| Trunk to arm ratio | 1.2 (0.4) | 0.9 (0.2) | 0.024 |
| Skeletal muscle mass index | 5.36 (0.6) | 5.07 (0.7) | 0.227 |
| Lean body mass DXA (%) | 79.9 (14.1) | 83.1 (8.2) | 0.491 |
| Lean body mass DXA (kg) | 25 (12.2) | 24.2 (4.4) | 0.850 |
| Total fat DXA (%) | 17.88 (8.4) | 16.91 (8.2) | 0.746 |
| Total fat DXA (kg) | 5.5 (4.12) | 5.25 (3.6) | 0.860 |
| Arm fat DXA (%) | 10.8 (9.6) | 11.5 (7.7) | 0.807 |
| Leg fat DXA (%) | 15.5 (6.8) | 21.1 (9.6) | 0.085 |
| Trunk fat DXA (%) | 20.1 (10.7) | 18.1 (9.4) | 0.564 |
| Android fat DXA (%) | 24.9 (13.7) | 17.7 (9.6) | 0.066 |
| Gynoid fat DXA (%) | 23.5 (8.8) | 29.3 (9.2) | 0.076 |
| DXA-limb to trunk ratio | 0.7 (0.2) | 1 (0.2) | 0.001 |
zBMI, body mass index z-score; HAz, height-for-age z-score; BIA, bioimpedance; DXA, dual-energy X-ray absorptiometry. Bold values mean the values that presented statistical difference.

With respect to waist circumference and other variables, we noted a positive correlation with trunk to arm ratio (r=0.42; p<0.007) and with zBMI (r=0.68; p=0.003) and a negative correlation with the limb to trunk ratio (r=−0.68; p=0.000). The trunk to arm ratio also showed a positive correlation with insulin (r=0.48; p=0.001) and HOMA-IR (r=0.45; p=0.004), showing metabolic changes resulting from central adiposity. As for biochemical tests, T CD4 lymphocytes and viral load showed a positive and negative correlation with total cholesterol (r=0.41; p<0.008; r=−0.50; p=0.001) and LDL cholesterol (r=0.49; p=0.001; r=−0.65; p=0.000), respectively. Viral load also showed a negative correlation with HAz (r=−0.47; p=0.002).
The linear regression used the trunk to arm ratio as a control variable and showed association with the arm circumference (β=0.71; p=0.045; IC 95%: 0.017–1.41) and HOMA-IR (β=0.14; p=0.026; IC 95%: 0.018–0.271).
DiscussionPrevalence of lipodystrophy in the study population (27.5%) was similar to results obtained in other groups, such as the US population (29%).17 Another Brazilian assessment found lipodystrophy in 14% of HIV-infected children.18
Scientific evidences suggest that lipohypertrophy and lipodystrophy itself are more frequent in pubescent children, as sexual maturity and hormonal factors may contribute to this outcome.12,19 The diagnosis of lipohypertrophy and mixed lipodystrophy in prepubertal children in this study may be explained by the advanced classification of the disease and high prevalence of dyslipidemia. Lipodystrophy, insulin resistance and dyslipidemia, with subsequent increase in cardiovascular risk, characterize the lipodystrophy syndrome, in which etiology seems to be related with some classes of antiretroviral drugs, such as PI and nucleoside reverse transcriptase inhibitors (NRTI); duration of drug administration; increase in viral load; low levels of CD4 and prior increase in serum levels of triglycerides and cholesterol.4,6
In this study population, there is a higher serum level of triglycerides and lower HDL cholesterol in patients with body fat redistribution. The European cohort related the presence of lipodystrophy with levels of triglycerides, insulin and blood glucose.20 A Spanish study with heterogeneous pediatric population (21 months to 18 years old) verified a higher prevalence of lipodystrophy within the higher age group and in the presence of hypertriglyceridemia, with no positive association with viral load, T CD4 lymphocyte, total cholesterol and glucose. With respect to classes of antiretroviral drugs, we did not note association with lipodystrophy. The current literature evidences conflicting data as to the presence of lipodystrophy associated with the use of PI. A US study with a population averaging 11.9 years showed no association21 between the drug use and this clinical change, while another Brazilian work, with a population averaging 9.1 years, verified a positive association between these two variables.22
The use of antiretroviral therapy plays a positive role as to maintenance or improvement of nutritional condition, however, in children with lipodystrophy, we noted a higher prevalence of short stature. Hormonal factors, nutritional condition, gastrointestinal and endocrine disorders, insufficient food intake and recurrent infection may also compromise height development.23,24 The mechanism by which this impairment occurs is not very well described in the literature, and it is possible to find divergences between researchers and reviews with respect to this topic.23,25
HIV infection is also characterized by hormonal disorders, of which we highlight the impairment of growth hormone/insulin-like growth factor-1 (GH/IGF-1). There seems to be a resistance to GH, with increase in its levels and decrease in IGF-1.26 Another hypothesis would be a change in IGF-1 levels, resulting from the improper synthesis of insulin-like growth factor binding protein-1 (IGFBP-1) and increase in insulin-like growth factor binding protein-3 (IGFBP-3).25 In infected children, resistance to GH and changes in production of cortisol directly affect the body mass and growth interruption.27 Interaction between hormonal disorders and lipodystrophy seems to be related to an increase in somatostatin tone, which will inhibit secretion of GH, decrease in ghrelin and decrease of GH caused by the increase in free fatty acids.28
GH and IGF-I act directly in muscle fibers, increasing protein synthesis and body mass. Nonetheless, in chronic diseases such as AIDS, the stress generated by a permanent inflammatory condition contributes through hepatic gluconeogenesis to the depletion of essential amino acids of the skeletal muscle.23 The fast loss of muscle mass results from acceleration in protein breakdown and degradation of myofibrillar proteins through activation of the ubiquitin proteasome system.29 In this alternative metabolic pathway, there is an activation of transcription factors (FoxO3) in cell nucleus, causing an increase in lysosomal and proteasomal proteolysis, which will be responsible for mitochondrial and myofibrillar loss.29 In physiological terms, when the IGF1/insulin – P13k-Akt signaling pathway is activated, FoxO3 is deactivated and cytosol is released.30
Lipodystrophy is classified on a clinical and subjective basis.3,7,8 Accordingly, the assessment of anthropometric measurements and body composition could be instruments that help detecting clinical and metabolic changes. Although the average value of waist circumference did not show a significant statistical difference (p=0.051), a result that may be limited due to the sample size, this variable was higher in the group with lipodystrophy. Additionally, values of correlation coefficient and linear regression showed that waist circumference is related to anthropometric indexes determining lipodystrophy. Some studies suggest that metabolic changes also result from central adiposity, as well as insulin resistance, which seems to be more pronounced in the presence of lipohypertrophy.31
A trunk to arm ratio may be a good parameter for body fat redistribution, which shows upper limb tapering and accumulation of fat in the abdominal area and dorsal hump.12 In this study, we demonstrated the positive association of this ratio with lipodystrophy. The higher the index obtained by the ratio, the greater the amount of fat in the trunk and reduction thereof in the upper limbs. This index is easy to apply, obtained through skinfolds, being feasible in clinical practice.
In the study population, no changes were verified in the percentage of fat in lower and upper limbs when compared to the groups with and without lipodystrophy, however the ratio limb to trunk obtained through DXA showed a strong correlation with this clinical change. In another study carried out with children using HAART compared to a control group, changes in body composition obtained through DXA were also noted, even in the absence of clinical signs of lipodystrophy.7 Therefore, the clinical diagnosis of lipodystrophy seems to be underestimated. Vigano et al., demonstrated that 31/37 of patients non-identified as lipodystrophic patients showed changes in body composition, such as fat reduction in lower limbs and increase in visceral adiposity through DXA. Only 8/37 of these patients were provided with the same clinical and image diagnosis of lipodystrophy.8
The results of this study show limitations as it is a cross sectional study, which only considers variables at the moment of data collection, in addition to the limited sample regarding population seen at this clinic. Thus, it would be ideal to have a cohort study to better assess the metabolic side effects compared to changes in body composition. On the other hand, the study shows a homogeneous sample as to age, pubertal stage, severity of the disease and use of antiretroviral drugs, supporting the results obtained.
Assessment of body composition through DXA has the disadvantage of requiring costly technology, therefore, the use of anthropometric measurements, obtained through skinfolds, presents a feasible and low-cost alternative.
The trunk to arm and limb to trunk ratios may be used as indicators of preclinical lipodystrophy. No cutoffs were established to such values yet, requiring subsequent studies; however, continuous monitoring of these ratios may identify changes in body composition of these patients early.
Conflict of interestAll authors declare to have no conflict of interest.
