


Cytomegalovirus may cause severe disease in immunocompromised patients. Nowadays, quantitative polymerase chain reaction is the gold-standard for both diagnosis and monitoring of cytomegalovirus infection. Most of these assays use cytomegalovirus automated molecular kits which are expensive and therefore not an option for small laboratories, particularly in the developing world.
ObjectiveThis study aimed to optimize and validate an in-house cytomegalovirus quantitative polymerase chain reaction test calibrated using the World Health Organization Standards, and to perform a cost-minimization analysis, in comparison to a commercial cytomegalovirus quantitative polymerase chain reaction test.
Study designThe methodology consisted of determining: optimization, analytical sensitivity, analytical specificity, precision, curve variability analysis, and inter-laboratorial reproducibility. Patients (n=30) with known results for cytomegalovirus tested with m2000 RealTime System (Abbott Laboratories, BR) were tested with the in-house assay, as well as patients infected with other human herpes virus, in addition to BK virus. A cost-minimization analysis was performed, from a perspective of the laboratory, assuming diagnostic equivalence of the methodologies applied in the study.
ResultsThe in-house assay had a limit of detection and quantification of 60.3IU/mL, with no cross-reactivity with the other viral agents tested. Moreover, the test was precise and had a R2 of 0.954 when compared with the m2000 equipment. The cost analysis showed that the assay was economically advantageous costing a median value of 37.8% and 82.2% in comparison to the molecular test in use at the hospital and the m2000 equipment, respectively.
ConclusionsThese results demonstrated that in-house quantitative polymerase chain reaction testing is an attractive alternative in comparison to automated molecular platforms, being considerably less expensive and as efficacious as the commercial methods.
Cytomegalovirus (CMV) is the largest human herpesvirus, which has been associated with severe infections in immunocompromised patients. The main populations at risk are HIV-infected patients,1 pregnant women (vertical transmission)2 and individuals who have undergone hematopoietic3 or solid organs transplants.4
In the 1990s, the methodology of choice for diagnosing and monitoring CMV infection/disease was CMV Pp65 antigenemia.5–8 However, due to known limitations of this technique and the advent of molecular diagnosis, polymerase chain reaction (PCR) became the test of choice to detect CMV, with the possibilities of qualitative and quantitative results.9,10 Molecular techniques have revolutionized the diagnosis of infectious diseases, improving the diagnostic turnaround times and accuracy in comparison to other methodologies already in place.11 Nevertheless, several publications demonstrated low reproducibility and standardization of the technique.12,13 In order to improve the performance of CMV PCR tests, in 2010 the World Health Organization (WHO) provided the 1st WHO International Standard for Human Cytomegalovirus (WHO IS).14 Almost 10 years later, there are few publications that evaluated the standardization of in-house tests for the diagnosis of CMV infection, using the WHO IS as a standard.15–20 The validation of in-house molecular tests may allow laboratories in developing countries to offer services at a reduced cost in comparison to commercial or automated platforms.17 This article follows the recommendations of the MIQE (Minimum Information for publication of Quantitative real-time PCR Experiments) guidelines and it is the first study that compares different molecular methodologies for cytomegalovirus detection with an economic analysis. Therefore, this study aimed to present a validation of a quantitative in-house real time PCR for CMV comparing with an automated platform using a cost-minimization analysis.
Materials and methodsPatients and samplesSamples were obtained from patients for whom molecular tests were requested at Hospital de Clínicas de Porto Alegre (HCPA) and Santa Casa de Misericórdia de Porto Alegre (ISCMPA), both large tertiary hospitals located in Porto Alegre, Southern Brazil. All samples used for the study were collected in 4mL EDTA tubes with separator gels, centrifuged at 1300×g for 15min and frozen at −80°C until nucleic acid extraction.
Nucleic acid extractionPlasma samples were extracted with Maxwell® 16 Viral Total Nucleic Acid Purification Kit (Promega, Brazil) following the manufacturer's instructions. The volume of plasma used for extraction was 300μL and the elution volume was 50μL.
Quantitative in-house real time PCR optimizationProbes and primers sequences are shown in the supplementary material.21 Both primers and probes were synthesized by Síntese Biotecnologia (Thermo Scientific, Brazil) with amplicon sizes of 105bp (UL 34-NC_006273.2) and 98bp (UL 80.5-NC_006273.2). Both genes are conserved in the virus genome and related to virus replication.22,23
Real time PCR (qPCR) tests were first optimized in simplex reactions, in order to determine the optimum primer and probe concentrations, as well as the ideal amount of DNA and reagents to be used in the assay. Primers were evaluated in the range of 0.3–0.5μM, and probes were tested in concentrations ranging from 0.20–0.30μM. Varying amounts of eluted DNA were tested, from 2–4μL of extracted material. Different PCR master mixes were also evaluated: GoTaq Probe qPCR Master Mix (Promega, BR), Platinum® Quantitative PCR SuperMix-UDG (Thermo Scientific, BR) and TaqMan® Gene Expression Master Mix (Thermo Scientific, BR). In addition, different concentrations of Reference Dye were tested, from 1:10 to 1:500. The thermocycling conditions for the qPCR reactions were: 1 cycle of 2min at 50°C; 2min at 95°C; followed by 40 cycles of 15s at 95°C, and 1min at 60°C, in a 7500 real time PCR system (Thermo Scientific, Brazil).
The standard curve used for secondary calibration standard was inserted into a plasmid, synthesized by Applied Biosystems (Thermo Scientific, BR). Sequences are shown in the supplementary material.
For each reaction we used as positive control the amplification of the standard curve and as negative control nuclease free water in the same amount as the eluted DNA.
Calibration curvesThe primary calibration standard used in this study was the 1st WHO International Standard for Human Cytomegalovirus NCBI code 09/132.24 Material was eluted in 1mL of nuclease-free water as indicated by the manufacturer, containing an initial concentration of 5×10⁶IU/mL. From this material, two aliquots were prepared for extraction, one containing 500μL of the standard diluted 1:2 in buffer (TE) and another in a 1:2 dilution of the CMV-free plasma in a final volume of 500μL to mimic the biological matrix.
The secondary pattern used in the study was a plasmid designed targeting both primers and probes sequences. The standard had an initial concentration of 9.65×10¹⁰copies/mL.
Analytical sensitivityTo determine the limit of quantification (LOQ), two different operators performed the analytical sensitivity test on three distinct days. The test consisted in a simplicata curve which was amplified in parallel for a base 10 dilution of the primary standard diluted in buffer (TE) (initial concentration of 2.5×10⁶IU/mL), the primary standard diluted in negative CMV plasma (initial concentration 2.5×10⁶IU/mL) and the secondary standard (initial concentration of 9.65×10⁵copies/mL). The standard dilution test and DNA extraction were also performed on three different days.
For the determination of the limit of detection (LOD), the lower point of the curve amplified by 95% of the time was diluted in base two, in triplicate. The concentration that consistently amplified 95% of the time was tested again, in triplicate.
The conversion factor was calculated by dividing the IU/mL amount from the primary standard, taking into account an estimated 80% efficiency in extraction, by the average number of copies/mL, for both genes, found in the three days of the test for each of the points of the curve of the secondary pattern. The median of these results was calculated.
Analytical specificityFor the determination of the analytical specificity, plasma samples from patients infected with herpes simplex (HSV)-1, HSV-2, Human Herpesvirus (HHV)-3, HHV-4, HSV-6, HSV-7, and BK virus (BKV) were extracted and tested.
PrecisionThe precision test was performed with two patient's samples with low (138IU/mL – 88.5copies/mL) and high concentration (20,508IU/mL – 13,146.2copies/mL) of CMV DNA, according to m2000 (Abbott Laboratories, BR) quantification in triplicate, in five different days. The cycle threshold (Ct) for each run was determined and the precision was analyzed by calculating the standard deviation (SD) and coefficient of variation (CV) for the replicates in the same day and in different days, in order to evaluate intra- and inter-assay variability.
Curve variability analysisCt variability in the secondary pattern curve analyses were performed along 10 different days, in simple reactions. The curve consists of five points, ranging from 9.65×10⁵ to 96.5copies/mL.
Inter-laboratory reproducibilityThis experiment was conducted with 30 samples that had been tested for CMV viral load, using the m2000 equipment (Abbott Laboratories,BR). For these samples, 10 had an undetected result when tested with the m2000; 10 had low concentrations, ranging from 47IU/mL – 30.11copies/mL (1.67 log IU/mL – 1.48log copies/mL) to 490IU/mL – 314.1copies/mL (2.69 log IU/mL – 2.5 log copies/mL); and 10 were at high concentrations, ranging from 976IU/mL – 625.6copies/mL (2.99 log IU/mL – 2.80 log copies/mL) to 20,508IU/mL – 13,146.2copies/mL (4.31 log IU/mL – 4.12 log copies/mL). The log difference was calculated to evaluate the performance of the test.
Assay costsAll results are expressed in US dollars (USD) considering USD quotation on March 4th, 2020 when 1 USD was equivalent to 5.3 BRL (Brazilian Real).25 To assess the cost of each test, direct and indirect costs for testing were considered. Direct costs were those related to the work time of the professionals, the materials used to perform the test, other materials used by the laboratory, equipment depreciation and overall laboratory costs. Indirect costs were related to third-party services (proficiency assay costs). Costs were calculated for the in-house assay, m2000 RealTime System (Abbott Laboratories, Brazil) assay, as well as for the test currently used in the hospital: Kit XGEN Master CMV (Mobius Life Science Product Trade for Laboratories Ltda, Brazil). A cost-minimization analysis and a sensitivity test were performed, from the laboratory perspective, to evaluate the reduction of costs in the utilization of each alternative.
EthicsThe present study was approved by the ethic committees with the following protocol numbers: 1.820.875 and 1.885.683. Written consent was obtained from patients before entering the study. All experiments were performed in compliance with relevant laws and institutional guidelines and in accordance with the ethical standards of the Declaration of Helsinki.
ResultsOptimizationThe qPCR optimization tests showed that the optimal concentration of reagents were: primers 0.4μM, probes 0.25μM, and DNA 3μL, respectively. All reagents tested were adequate for amplification of the secondary pattern, and no amplification was seen with the primary standard for Platinum® Quantitative PCR SuperMix-UDG reagent (Applied Biosystems, USA). Therefore, taking into consideration the performance (early Ct) and cost of the reagents, GoTaq Probe qPCR Master Mix (Promega, USA) was chosen as the master mix for the assay. The results of the Cts for the negative control were undetected for all reagents, for the primary standard the Cts were undetected for the Platinum® Quantitative PCR SuperMix-UDG reagent, 24.35 (UL34) and 23.19 (UL80.5) for GoTaq Probe qPCR Master Mix and 27.87 (UL34) and 26.17 (UL80.5) for TaqMan® Gene Expression Master Mix. The secondary standard showed Cts results of 13.79 (UL34) and 13.74 (UL80.5) for Platinum® Quantitative PCR SuperMix-UDG reagent, 14.86 (UL34) and 14.42 (UL80.5) for GoTaq Probe qPCR Master Mix and 17.35 (UL34) and 16.37 (UL80.5) for TaqMan® Gene Expression Master Mix. Finally, the reference dye carboxy-X-rhodamine (CXR) tests showed that the ideal dilution was 1:50.
Analytical sensitivityThe tests performed with the primary standard diluted in the biological matrix revealed no amplification in the last three points of the curve. The curves performed did not show r2>0.99 and adequate slope or efficiency. The r2 results were 0.931, 0.934, 0.933, 0.933, 0.904, and 0.998, with slope of 3.694, 3.224, 3.726, 3.211, 2.62, and 3.474 and efficiency of 86.507, 104.332, 85.526, 104.861, 140.788, and 94.023. Therefore, calibrations for the secondary standard were performed with the primary standard diluted in buffer, and the results of the qPCR parameters are shown in Fig. 1. The analytical sensitivity for determination of the threshold for each of the genes was 0.21 (UL34) and 0.12 (UL80.5). The conversion factor was 0.29. The LOQ and the LOD of the test was the same, 60.26IU/mL.
Analytical specificity
No cross-reactivity was observed in the analytical specificity assay for HSV-1, HSV-2, HHV-3, HHV-4, HSV-6, HSV-7, and BKV in this study.
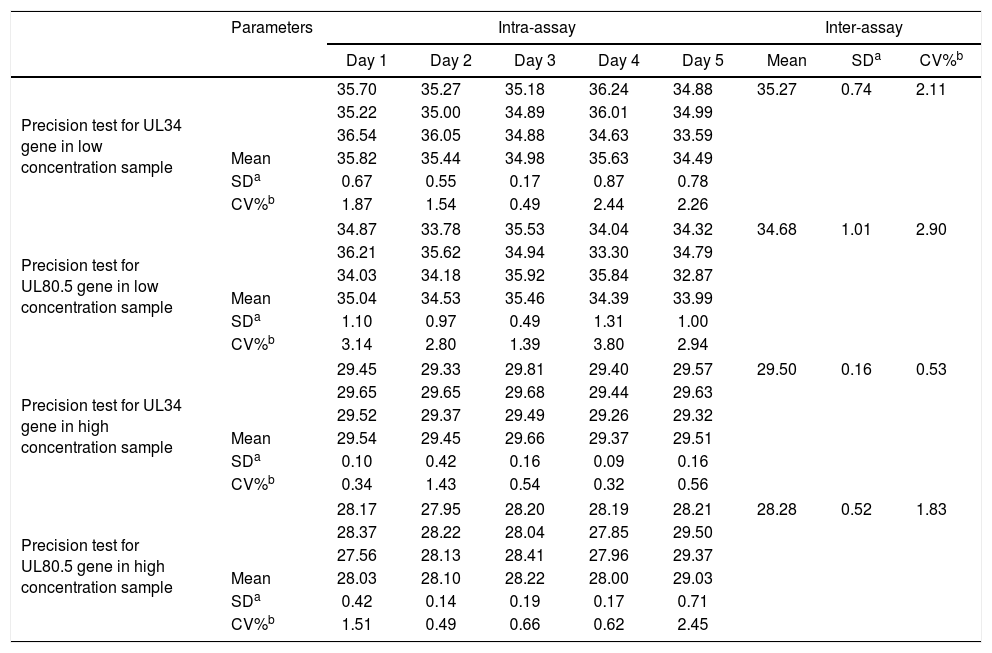
PrecisionFor precision assessment, an intra- and inter-assay evaluation of the Ct results of both CMV genes for each sample, low (138IU/mL) and high concentrations (20,508IU/mL) of CMV DNA was used, as shown in Table 1.
Precision test for cytomegalovirus UL34 and UL80.5 genes in low and high concentration samples. Numbers represent cycle threshold (Ct) values.
| Parameters | Intra-assay | Inter-assay | |||||||
|---|---|---|---|---|---|---|---|---|---|
| Day 1 | Day 2 | Day 3 | Day 4 | Day 5 | Mean | SDa | CV%b | ||
| Precision test for UL34 gene in low concentration sample | 35.70 | 35.27 | 35.18 | 36.24 | 34.88 | 35.27 | 0.74 | 2.11 | |
| 35.22 | 35.00 | 34.89 | 36.01 | 34.99 | |||||
| 36.54 | 36.05 | 34.88 | 34.63 | 33.59 | |||||
| Mean | 35.82 | 35.44 | 34.98 | 35.63 | 34.49 | ||||
| SDa | 0.67 | 0.55 | 0.17 | 0.87 | 0.78 | ||||
| CV%b | 1.87 | 1.54 | 0.49 | 2.44 | 2.26 | ||||
| Precision test for UL80.5 gene in low concentration sample | 34.87 | 33.78 | 35.53 | 34.04 | 34.32 | 34.68 | 1.01 | 2.90 | |
| 36.21 | 35.62 | 34.94 | 33.30 | 34.79 | |||||
| 34.03 | 34.18 | 35.92 | 35.84 | 32.87 | |||||
| Mean | 35.04 | 34.53 | 35.46 | 34.39 | 33.99 | ||||
| SDa | 1.10 | 0.97 | 0.49 | 1.31 | 1.00 | ||||
| CV%b | 3.14 | 2.80 | 1.39 | 3.80 | 2.94 | ||||
| Precision test for UL34 gene in high concentration sample | 29.45 | 29.33 | 29.81 | 29.40 | 29.57 | 29.50 | 0.16 | 0.53 | |
| 29.65 | 29.65 | 29.68 | 29.44 | 29.63 | |||||
| 29.52 | 29.37 | 29.49 | 29.26 | 29.32 | |||||
| Mean | 29.54 | 29.45 | 29.66 | 29.37 | 29.51 | ||||
| SDa | 0.10 | 0.42 | 0.16 | 0.09 | 0.16 | ||||
| CV%b | 0.34 | 1.43 | 0.54 | 0.32 | 0.56 | ||||
| Precision test for UL80.5 gene in high concentration sample | 28.17 | 27.95 | 28.20 | 28.19 | 28.21 | 28.28 | 0.52 | 1.83 | |
| 28.37 | 28.22 | 28.04 | 27.85 | 29.50 | |||||
| 27.56 | 28.13 | 28.41 | 27.96 | 29.37 | |||||
| Mean | 28.03 | 28.10 | 28.22 | 28.00 | 29.03 | ||||
| SDa | 0.42 | 0.14 | 0.19 | 0.17 | 0.71 | ||||
| CV%b | 1.51 | 0.49 | 0.66 | 0.62 | 2.45 | ||||
For gene UL34, the mean Ct for the points 9.65×10⁵, 9.65×10⁴, 9.65×10³, 9.65×10², 9.65×101 were, respectively, 20.76, 24.08, 27.59, 31.27 and 34.74. Mean SD between curve points was 1.23, and CV was 4.55. For gene UL80.5, mean Ct for the same points were 19.55, 22.89, 26.32, 30.03 and 33.52, respectively. Mean SD was 1.21 and CV was 4.72.
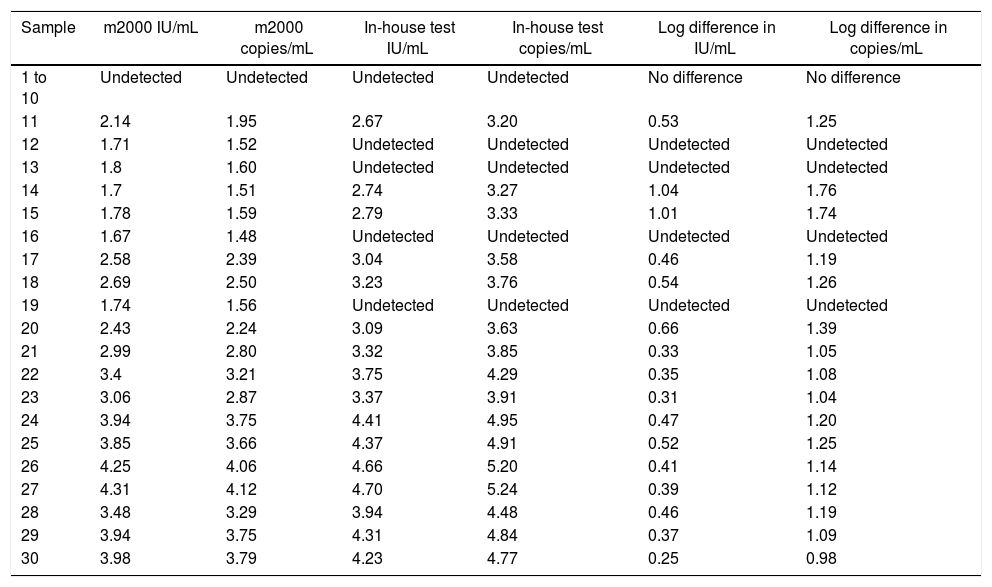
Inter-laboratory reproducibilityResults of the in-house test in comparison with the commercial m2000 equipment (Abbott Laboratories, BR) is presented in Table 2. Fig. 2 shows the relationship between the results found by the m2000 equipment and the in-house test.
Comparison between results of patient samples. Numbers represent concentrations of cytomegalovirus DNA in plasma (IU/mL and copies/mL) expressed in log10 otherwise stated.
| Sample | m2000 IU/mL | m2000 copies/mL | In-house test IU/mL | In-house test copies/mL | Log difference in IU/mL | Log difference in copies/mL |
|---|---|---|---|---|---|---|
| 1 to 10 | Undetected | Undetected | Undetected | Undetected | No difference | No difference |
| 11 | 2.14 | 1.95 | 2.67 | 3.20 | 0.53 | 1.25 |
| 12 | 1.71 | 1.52 | Undetected | Undetected | Undetected | Undetected |
| 13 | 1.8 | 1.60 | Undetected | Undetected | Undetected | Undetected |
| 14 | 1.7 | 1.51 | 2.74 | 3.27 | 1.04 | 1.76 |
| 15 | 1.78 | 1.59 | 2.79 | 3.33 | 1.01 | 1.74 |
| 16 | 1.67 | 1.48 | Undetected | Undetected | Undetected | Undetected |
| 17 | 2.58 | 2.39 | 3.04 | 3.58 | 0.46 | 1.19 |
| 18 | 2.69 | 2.50 | 3.23 | 3.76 | 0.54 | 1.26 |
| 19 | 1.74 | 1.56 | Undetected | Undetected | Undetected | Undetected |
| 20 | 2.43 | 2.24 | 3.09 | 3.63 | 0.66 | 1.39 |
| 21 | 2.99 | 2.80 | 3.32 | 3.85 | 0.33 | 1.05 |
| 22 | 3.4 | 3.21 | 3.75 | 4.29 | 0.35 | 1.08 |
| 23 | 3.06 | 2.87 | 3.37 | 3.91 | 0.31 | 1.04 |
| 24 | 3.94 | 3.75 | 4.41 | 4.95 | 0.47 | 1.20 |
| 25 | 3.85 | 3.66 | 4.37 | 4.91 | 0.52 | 1.25 |
| 26 | 4.25 | 4.06 | 4.66 | 5.20 | 0.41 | 1.14 |
| 27 | 4.31 | 4.12 | 4.70 | 5.24 | 0.39 | 1.12 |
| 28 | 3.48 | 3.29 | 3.94 | 4.48 | 0.46 | 1.19 |
| 29 | 3.94 | 3.75 | 4.31 | 4.84 | 0.37 | 1.09 |
| 30 | 3.98 | 3.79 | 4.23 | 4.77 | 0.25 | 0.98 |

Samples from 37 patients were used for laboratory validation, all of them were kidney transplanted patients in a post-transplant follow-up. Of these, 32 (86.5%) were Caucasian, 22 (59.5%) were men and the median age of patients were 55.2 (range 21–71). The cause of the end stage renal disease was unknown for 10 patients (27.0%). The underlying diseases found in the population were: 7 (18.9%) polycystic kidneys, 6 (16.2%) focal segmental glomerulosclerosis, 6 (16.2%) type 2 diabetes mellitus, 3 (8.1%) systemic arterial hypertension, 2 (5.4%) type 1 diabetes mellitus,1 (2.7%) Berger's disease, 1 (2.7%) Alport's disease, and 1 (2.7%) chronic glomerulonephritis.
Economic study by Cost-Minimization Analysis (CMA)The total cost of testing per patient for the in-house qPCR assay was USD 79.62 for testing, taken into consideration that a single sample is tested. Cost decreases as the number of samples increased per run: for 10 samples the unitary cost was USD 18.22; for 30, 50 and 90 samples, cost was USD 13.62, USD 12.70 and USD 12.09, respectively.
For the assay performed on the m2000 RealTime System Equipment (Abbott Laboratories, Brazil) the unitary cost per exam was USD 449.42 for a single sample; for 10 samples, it was USD 102.19; and for 30, 50 and 90 samples: USD 76.47, USD 71.32 and USD 67.89, respectively.
Cost of the test currently in use at the hospital was USD 87.82 for a single sample; for 10 samples: USD 26.50; and 30, 50 and 90 samples, costs were USD 21.91, USD 20.99 and USD 20.38, respectively.
In this analysis, the cost reduction between in-house and m2000 RealTime assays was of USD 369.80, USD 83.97, USD 62.85, USD 58.62 and USD 55.80 for 1, 10, 30, 50 and 90 samples, respectively. In the comparison between the in-house assay versus the kit used in the hospital, cost reductions were of USD 08.20, USD 10.57, USD 08.29, USD 08.29, and USD 08.29. The test currently in use in the hospital was more economically advantageous than the m2000 RealTime assay: USD 361.60, USD 73.40, USD 54.56, USD 50.33 and USD 47.51. In the sensitivity analysis for 10 samples being tested at the same time, the final cost of examinations ranging from 5–10% of the salaries of the professionals involved was USD 18.37–18.44, USD 26.57–26.64, USD 102.39–102.59 for the in-house test, commercial kit and m2000, respectively. The cost considering a 5%–10% increase in reagents was USD 19.03–19.76, USD 27.64–28.79, USD 106.00–109.81 for the in-house test, commercial kit and m2000, respectively. The cost minimization percentage and the economic impact of the exam cost variation are presented in Fig. 3.

From December 2016 to December 2017, 300 patients had a kidney transplant in Santa Casa de Misericórdia de Porto Alegre. These patients need weekly evaluation for CMV in the first three months after transplantation with a total of 12 samples approximately. In a scenario of 10 to 30 samples per day of test the minimization of costs goes from USD 38,052 (10 samples per run) to USD 29,844 (30 samples per run) per year using the in-house assay compared to the test currently being used; when contrasted with m2000 RealTime assay the cost-minimization would be USD 302,292 (10 samples) and USD 226,260 (30 samples) yearly.
DiscussionFor CMV infection and disease, molecular tests are currently considered the gold-standard for diagnosis and monitoring.26–29 However, molecular diagnosis has some limitations, which have been addressed in this study. The first issue is variation between PCR quantification by different laboratories, especially related to the size of the amplicons reported in previous articles.30,31 In order to reduce such variabilities, primers and probes were chosen for amplicons of 98 and 105bp. Naegele et al. suggested in their work the standardization of amplicon size of 100bp, and they also discuss the better reproducibility of tests using redundant targets, while others pointed out to dual targets as a better possibility.20,30–33 As raised in previous studies, due to the high qPCR test sensitivity and the lack of clear cut-off to determine the need for antiviral treatment, the use of qPCR could increase considerably the number of patients treated without a real need for it. To reduce this possibility, plasma was chosen in this study as a matrix for the test, since previous works have demonstrated that in plasma the virus probably presents itself in fragmented form, while in whole blood the presence of fragmented and intracellular forms increase viral load and the chances for detecting latent infection.28,34,35
Regarding to test optimization, although several articles showed differences in results when international standards are tested with different reagents and methods,12,31,35,36 none had reported non-functioning with some reagents such as Platinum® Quantitative PCR SuperMix-UDG reagent (Applied Biosystems, Brazil), as observed in this study. The causes for non-functioning are uncertain, but when analyzing the reagent labels for possible causes, Platinum® Quantitative PCR SuperMix-UDG reagent (Applied Biosystems, Brazil) and GoTaq Probe qPCR Master Mix (Promega, Brazil) differ by the presence of UDG. TaqMan® Gene Expression Master Mix (Thermo Scientific, Brazil) also uses UDG which would not explain the non-amplification of the primary standard, leading to believe that the problem could be in the buffer components (information that is not listed in detail in any of the package inserts), or in the concentration of the reagents (information contained only in the Platinum® Quantitative PCR SuperMix-UDG reagent package). Still on the optimization, the efficiency of the multiplex reaction is within the ideal range, close to 90%.
Our in-house test demonstrated acceptable sensitivity, as shown by the limit of detection and quantification of 60.26IU/mL, being similar to those stated in the package insert of Abbott m2000 (31.20IU/mL for both parameters). This observed difference is probably due to the distinct extraction methodologies and reagents used for the tests, as well as the fact that the equipment m2000 performed the tests in a totally automated way, excluding operator-dependent bias.31,35 Also, it is important to note that the thresholds for starting therapy reported in recent studies are up to 2000IU/mL, so the difference in the LOD and LOQ are not clinically relevant.28 In addition, the test was specific for CMV, since it did not cross-react with other human herpesviruses, nor did it show BKV amplification, which is of clinical importance in immunosuppressed as well as transplanted patients. Intra-assay and inter-assay evaluation showed high repeatability and reproducibility of the assay for both low and high concentrations, with CV results of <5% in all readings.
Regarding inter-laboratory reproducibility, the 10 samples below the LOD of the m2000 equipment were also below the LOD of the test, a result already expected since our limit of detection is numerically higher. Of the 20 tests between low and high samples, five were below our LOD; of these, two samples amplified, however with a quantitative CMV DNA log difference of >1. Out of the 20 samples amplified in the m2000 equipment, 80.0% (16/20) was also amplified in the test. The test failed to amplify one of the samples, which was quantified by the m2000 equipment at 62IU/mL, close to the LOD (a concentration that is not clinically relevant). Similarly, other amplification failures occurred with samples with concentrations below the LOD. From the 16 samples quantified by the test, it was possible to observe an r2 of 0.9544 when compared with the m2000 results. Evaluating the log difference of the test and m2000, it was found that 62.5% (10/16) had a difference <0.5 log and that 87.5% (14/16) had a difference <0.7 log. The mean log difference was 0.51, which is similar to what has been described in other studies.16,37–40 This difference of results found in this study is explained by the difference between the protocols used for DNA extraction, one of them automated and the other semi-automated. Besides, the difference can be related to the reagents used in each of the tests and in the fact that automation of the test reduces the operator-dependent factors differently from the in-house test.31,35 In addition, it is important to emphasize as a limitation of this test that the standard used in the test was diluted in TE for calibration of our secondary pattern. However, in the three days of the sensitivity test the pattern did not show amplification for the 2.5×10², 2.5×101 and 2.5×100, and had a curve with efficiency below 90%. Moreover, Jones et al. evaluated the commutability of the WHO IS and reported the use of the buffer as an alternative to plasma.41
Regarding the WHO international standard, it is important to note that although it has improved the harmonization of the CMV tests, recent studies are finding variability that were close to 0.5 log IU/mL. Yet, it was not possible to state that commutability between tests was reached. Recent studies reported difficulties, such as differences in DNA quantification using the same methodology but with different extraction methods until different behavior between the standard and samples because of the presentation of CMV.30,31,35,36,41–43
The validation presented in this paper showed that the in-house assay could be considered a diagnostic equivalent to the automated test, considering its precision, analytical sensitivity and specificity. In order to evaluate the economic impact of this test a cost-minimization analysis was undertaken. The cost analysis performed shows that the in-house qPCR assay was, in median, 37.8% (range 9.3–40.7%) less expensive than the test currently used in the hospital. When compared in-house versus m2000 assay using different scenarios the median percentage of cost-minimization was 82.2% (range 82.17–82.28%). A median reduction of 82.2% of the costs with the in-house method in relation to m200 RealTime System represents a considerable minimization of costs, especially for a budget adjustment and better distribution of resources in the clinical laboratory. It is important to note that this significant difference in value between exams makes it possible to use in-house assays in centers with low demand or limited budgets. In addition, it is emphasized that in case of transplanted patients, post-transplant CMV monitoring is performed weekly, which ends up burdening health plans and systems. In this context, in-house molecular testing becomes a less expensive and equivalent alternative.
The CMA applied in this study is a tool used in pharmacoeconomics when comparing health strategies to decide which is the most economically advantageous. It was observed in the present study, an economic projection that varies from USD 29,844 to USD 264,240 with the in-house test when compared to the commercial kit and m2000, respectively.
Researchers suggest that an economic analysis should be performed, because the greater the progress of medicine, the higher the cost to obtain further improvements. Therefore, it is necessary to decide what is the best way to spend such resources and to use them rationally.44,45 Noteworthy, simulations were considered in different scenarios addressing increased costs with professionals and reagents to verify the data robustness and reliability. It was found that when there is a 5% and 10% increase in the salaries of the professionals who perform the tests, there was a greater increase in the cost of in-house PCR. However, the final price is still lower than for the other tests. Nevertheless, when there is a variation in reagent costs by 5% and 10%, there is a considerable cost increase in the three methodologies, even though the commercial kit had the greatest impact, but still the final value of in-house PCR remains more advantageous.
The main limitation of this study is the lack of clinical data. However, a cohort of patients was evaluated and the results will be presented in future studies. In addition, as noted above, the primary standard was diluted in TE rather than plasma due to the unsuitable results presented above. Besides that, the economic data presented in this study cannot be generalized for other laboratories due to the variability between different molecular test designs and their costs. Another point to emphasize is the impact of the fluctuation of the US dollar on imports (currently USD 1 equals 5.6 Brazilian Reais vs. 3.2 Brazilian Reais in the study period), which increases the cost of reagents.
ConclusionIn this study, we performed the analytical validation of an in-house qPCR assay for CMV compared to the automated test of the m2000 equipment. The test was sensitive, specific and precise, and showed good linearity with the m2000 equipment. The results show that the in-house methodology is diagnostically equivalent to m2000, since the differences between the tests occurred close to the LOD and LOQ, which are not clinically relevant once the thresholds for beginning treatment, presented in the last studies are above 2000IU/mL. Therefore, a cost-minimization analysis was performed pointing out the in-house test as a more economically advantageous alternative, allowing laboratories with budget constraints to offer this diagnostic tool. The cost-minimization presented by the in-house test was maintained after the sensitivity analysis, demonstrating the robustness of the findings. Furthermore, it is important to notice that it has been recently discovered that CMV can be found in diverse forms in different matrices, which impacts on the size of the primers and probes and viral dynamics in infected patients. The total commutability was not achieved but today it is possible to perform an in-house test and the results be comparable with automated platforms as shown in this study.
FundingThis work was supported by a grant from Coordenação de Aperfeiçoamento de Pessoal de Nível Superior (CAPES) by a budget earmarked for Universidade Federal de Ciências da Saúde de Porto Alegre. The funding sources were not involved in the study design, neither in the collection, analysis and interpretation of data, and article preparation for publication.
Conflicts of interestThe authors declare no conflicts of interest.
We thank Universidade Federal de Ciências da Saúde de Porto Alegre, Santa Casa de Misericórdia de Porto Alegre e Hospital de Clínicas de Porto Alegre for the infrastructure for this study.
The following are Supplementary data to this article:
