
Darunavir has been proven efficacious for antiretroviral-experienced HIV-1-infected patients in randomized trials. However, effectiveness of darunavir-based salvage therapy is understudied in routine care in Brazil.
MethodsRetrospective cohort study of HIV-1-infected patients from three public referral centers in Belo Horizonte, who received a darunavir-based therapy between 2008 and 2010, after virologic failure. Primary endpoint was the proportion of patients with viral load<50copies/mL at week 48. Change in CD4 cell count was also evaluated. Outcome measures were analyzed on an intent-to-treat basis applied to observational studies. Sensitivity analysis was conducted to evaluate the impact of missing data at week 48. Predictors of virologic failure were examined using rare-event, finite sample, bias-corrected logistic regression.
ResultsAmong 108 patients, the median age was 44.2 years, and 72.2% were male. They had long-standing HIV-1 infection (median 11.6 years) and advanced disease (76.9% had an AIDS-defining event). All patients had previously received protease inhibitors and nucleoside reverse transcriptase inhibitors, 75% nonnucleoside reverse transcriptase inhibitors, and 4.6% enfuvirtide. The median length of protease inhibitor use was 8.9 years, and 90.8% of patients had prior exposure to unboosted protease inhibitor. Genotypic resistance profile showed a median of three primary protease inhibitor mutations and 10.2% had three or more darunavir resistance-associated mutations. Virologic success at week 48 was achieved by 78.7% (95% CI=69.7–86%) of patients and mean CD4 cell count increase from baseline was 131.5cells/μL (95% CI=103.4–159.6). In multiple logistic regression analysis, higher baseline viral load (RR=1.04 per 10,000copies/mL increase; 95% CI=1.01–1.09) and higher number of darunavir resistance-associated mutations (RR=1.23 per each; 95% CI=0.95–1.48) were independently associated with virologic failure.
ConclusionVirologic suppression is a realistic endpoint for most treatment-experienced patients who begin a darunavir-based therapy outside the controlled conditions of a randomized trial, at routine care settings.
The improved potency and tolerability of antiretroviral (ARV) drugs and the accumulated knowledge about their ideal combination enabled a higher proportion of long-term virologic suppression in randomized clinical trials of initial ARV therapy (ART) in HIV-1-infected patients.1–5 Cohort studies also showed an increased virologic response with initial ART, evidencing the applicability of clinical trials results to the clinical practice.6,7 Additionally, studies that analyzed clinical outcomes of initial ART found no significant divergence between efficacy in clinical trials and effectiveness in routine care.8,9
There is cumulative evidence from randomized trials that treatment of ARV-experienced patients with third-line drugs is efficacious.10–14 However, salvage therapy remains understudied in routine clinical care, especially in low- and middle-income countries.15–19 Therefore, it is important to ascertain clinical outcomes of third-line drugs outside the controlled conditions of a randomized trial and in the Brazilian context. In this study, we assessed virologic, immunologic, and clinical outcomes of ARV-experienced patients who initiated darunavir (DRV)-based salvage therapy in routine care settings. We also analyzed risk factors associated with virologic failure.
Materials and methodsWe conducted a retrospective cohort study to evaluate virologic and immunologic response and risk factors for virologic failure in patients from three public referral centers (one tertiary center and two secondary centers) for HIV treatment in Belo Horizonte, Brazil, failing ART (viral load≥50copies/mL) and that started a DRV-based regimen between 2008 and 2010. Adult patients (≥18 years) on regular follow-up and with a HIV-1 drug-resistant virus (at least 1 primary protease inhibitor mutation) and/or a treatment history of unboosted protease inhibitor in a failing regimen were eligible. Patients without a genotyping test performed in the 18 months prior to DRV-based therapy and those who received etravirine, tipranavir, maraviroc or vicriviroc concurrently with DRV were excluded, as these drugs were not then available through the Brazilian Public Health Care System.
Patient clinical charts were reviewed to gather data about demographic characteristics, baseline and nadir CD4 cell count, baseline and highest viral load, ART history, cumulative genotype, and optimized background therapy (OBT). The cumulative genotype was obtained by summing up all the resistance mutations detected in the latest and historical genotyping resistance tests.20,21 ARV resistance mutations were defined according to the December 2009 International AIDS Society-USA (IAS-USA) list.22 The genotypic sensitivity was based on the Brazilian Algorithm for Interpretation of HIV-1 Genotype – version 10 (www.aids.gov.br), that assigned three levels of drug resistance: susceptible (S), intermediate-level resistance (I) or high-level resistance (R). To assess the number of active drugs in the DRV-based therapy, a genotypic sensitivity score was calculated by assigning a score for each drug, based on the level of viral resistance (i.e., of 1 to S, 0.5 to I and 0 to R) and then adding up the scores. Raltegravir and enfuvirtide were considered fully active drugs (S) except for patients with previous use in a failing regimen.17
Primary endpoint was the proportion of patients with viral load<50copies/mL at week 48 (±4 weeks). Secondary endpoints were changes from baseline in CD4 cell counts, and the proportion of patients who experienced an AIDS-defining event or death. Analysis was conducted on an intent-to-treat basis applied to observational studies.23 The following were considered treatment failures if they occurred before week 52: patient death, DRV interruption for any cause, or any change in the OBT resulting in higher antiviral activity. For virologic endpoint, these patients were considered as virologic failures and for the immunologic endpoint, changes from baseline CD4 cell counts were considered as being zero. For all other situations with missing viral load and/or CD4 cell count at week 48 (±4), two strategies for data analysis were adopted. In strategy 1, the first available information after week 52 was carried backward and, when the latter was unavailable, the last observation before week 44 was carried forward. As for strategy 2, last observation before week 44 was carried forward and any available information after week 52 was ignored.
In the descriptive analysis, values of qualitative variables were expressed in terms of absolute and relative frequencies, and values of numerical variables as median, 25th and 75th percentiles. The Kolmogorov–Smirnov test and visual inspection of histograms were used to test the normal distribution of quantitative data. Differences in the distribution of numerical variables between baseline and week 48 (±4) were analyzed by the Wilcoxon test.
In univariate analysis of unmatched groups, categorical data were compared using analysis of contingency tables and chi-square test or Fisher exact test, as appropriate; numerical variables were compared using the Mann–Whitney U-test. Multiple regression analysis of factors associated with virologic failure was conducted using logistic regression models with backward manual elimination of variables. Candidate variables were those associated with virologic failure with a p-value≤0.3 in the univariate analysis, as well as those with high clinical relevance, irrespective of their statistical significance. Variables with a p-value≤0.1 and those with significant effect modification on clinically relevant variables were kept in the final models. The method proposed by King and Zeng and implemented in the ReLogit© macro for Stata was used to adjust regression coefficients for the rare event, finite sample bias.24–26 The commands setx and relogitq, available in the same macro, were used to estimate the effect sizes of variables in terms of relative risks instead of odds ratios.
Statistical analyses were performed with Stata for Windows (version 11.2, StataCorp, College Station, TX).
This study was conducted in accordance with Resolution 196/96 of the Brazilian National Research Ethics Commission (CONEP) and had the approval by the Research Ethics Committees of each participating center.
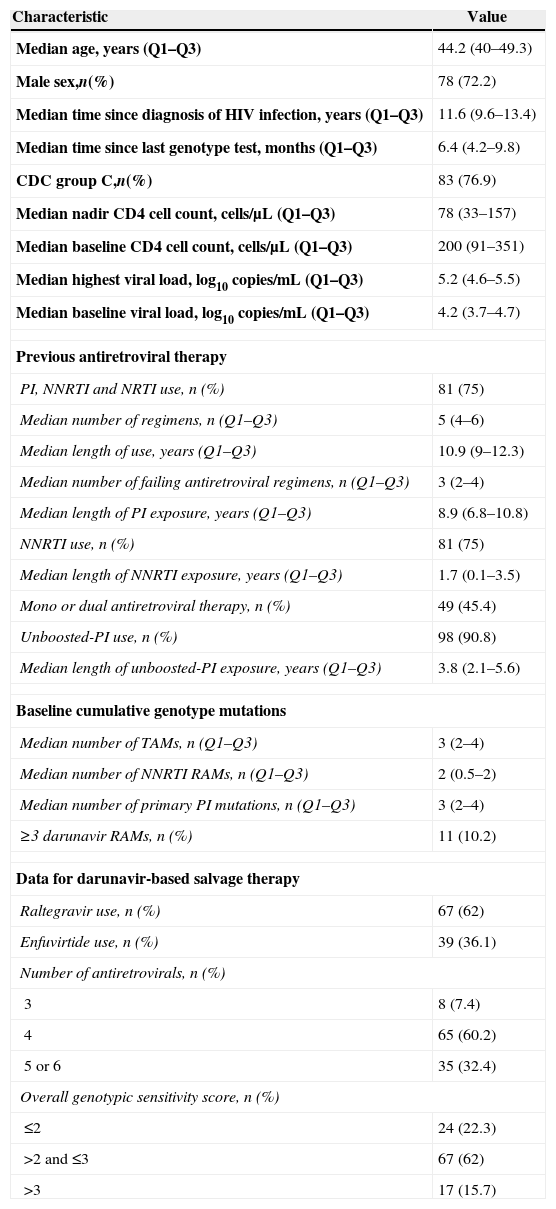
ResultsOverall, 108 patients met inclusion criteria and were eligible for analysis. Demographic and baseline characteristics are described in Table 1. Most were male adults from Belo Horizonte metropolitan area (86.1%). They had long-standing HIV-1 infection and advanced disease, as confirmed by the high proportion of past AIDS-defining events and low nadir CD4 cell count. Patients also had an extensive ART history with a significant exposure to unboosted protease inhibitor (90.8%); still, only 10.2% had three or more DRV resistance-associated mutations (RAMs). Among those who received a DRV-based therapy, raltegravir association was common and most patients had more than two fully active drugs (77.7%).
Demographic and baseline characteristics of patients.
| Characteristic | Value |
|---|---|
| Median age, years (Q1–Q3) | 44.2 (40–49.3) |
| Male sex,n(%) | 78 (72.2) |
| Median time since diagnosis of HIV infection, years (Q1–Q3) | 11.6 (9.6–13.4) |
| Median time since last genotype test, months (Q1–Q3) | 6.4 (4.2–9.8) |
| CDC group C,n(%) | 83 (76.9) |
| Median nadir CD4 cell count, cells/μL (Q1–Q3) | 78 (33–157) |
| Median baseline CD4 cell count, cells/μL (Q1–Q3) | 200 (91–351) |
| Median highest viral load, log10copies/mL (Q1–Q3) | 5.2 (4.6–5.5) |
| Median baseline viral load, log10copies/mL (Q1–Q3) | 4.2 (3.7–4.7) |
| Previous antiretroviral therapy | |
| PI, NNRTI and NRTI use, n (%) | 81 (75) |
| Median number of regimens, n (Q1–Q3) | 5 (4–6) |
| Median length of use, years (Q1–Q3) | 10.9 (9–12.3) |
| Median number of failing antiretroviral regimens, n (Q1–Q3) | 3 (2–4) |
| Median length of PI exposure, years (Q1–Q3) | 8.9 (6.8–10.8) |
| NNRTI use, n (%) | 81 (75) |
| Median length of NNRTI exposure, years (Q1–Q3) | 1.7 (0.1–3.5) |
| Mono or dual antiretroviral therapy, n (%) | 49 (45.4) |
| Unboosted-PI use, n (%) | 98 (90.8) |
| Median length of unboosted-PI exposure, years (Q1–Q3) | 3.8 (2.1–5.6) |
| Baseline cumulative genotype mutations | |
| Median number of TAMs, n (Q1–Q3) | 3 (2–4) |
| Median number of NNRTI RAMs, n (Q1–Q3) | 2 (0.5–2) |
| Median number of primary PI mutations, n (Q1–Q3) | 3 (2–4) |
| ≥3 darunavir RAMs, n (%) | 11 (10.2) |
| Data for darunavir-based salvage therapy | |
| Raltegravir use, n (%) | 67 (62) |
| Enfuvirtide use, n (%) | 39 (36.1) |
| Number of antiretrovirals, n (%) | |
| 3 | 8 (7.4) |
| 4 | 65 (60.2) |
| 5 or 6 | 35 (32.4) |
| Overall genotypic sensitivity score, n (%) | |
| ≤2 | 24 (22.3) |
| >2 and ≤3 | 67 (62) |
| >3 | 17 (15.7) |
Q1–Q3, 25th and 75th percentiles; CDC, Center for Disease Control and Prevention; PI, protease inhibitor; NRTI, nucleoside reverse transcriptase inhibitor; NNRTI, nonnucleoside reverse transcriptase inhibitor; RAMs, resistance-associated mutations; TAM, thymidine-associated mutation.
At week 48, virologic success (viral load<50copies/mL) was achieved by 85 patients (78.7%; 95% CI=69.7–86%) according to strategy 1 for handling missing data, and by 87 patients (80.6%; 95% CI=71.8–87.5%) according to strategy 2. In strategy 1 analysis, 56.5% had a viral load available after week 52 carried backward and 8.3% had a viral load available before week 44 carried forward; 66.7% of the latter were from week 36 or after. In strategy 2, 63% had a viral load available before week 44 carried forward and 79.4% were from week 36 or after. Mean CD4 cell count increase from baseline was 131.5cells/μL (95% CI=103.4–159.6; p<0.001) considering strategy 1 and 107.7cells/μL (95% CI=83.5–131.9; p<0.001) for strategy 2.
Seven patients (6.5%) were diagnosed with eight AIDS-defining events before week 52: Candida esophagitis (n=2), Pneumocystis pneumonia (n=2), and one case each of recurrent pneumonia, Cryptococcus meningoencephalitis, extra-pulmonary tuberculosis, and non-Hodgkin B-cell lymphoma. One patient was diagnosed with visceral leishmaniasis. Up to week 52, three patients (2.8%) died. Two of them had previously been diagnosed with opportunistic infections (Pneumocystis pneumonia and Cryptococcus meningoencephalitis). One patient withdrew DRV before week 52 to avoid drug interaction with rifampin, prescribed for confirmed extrapulmonary tuberculosis.
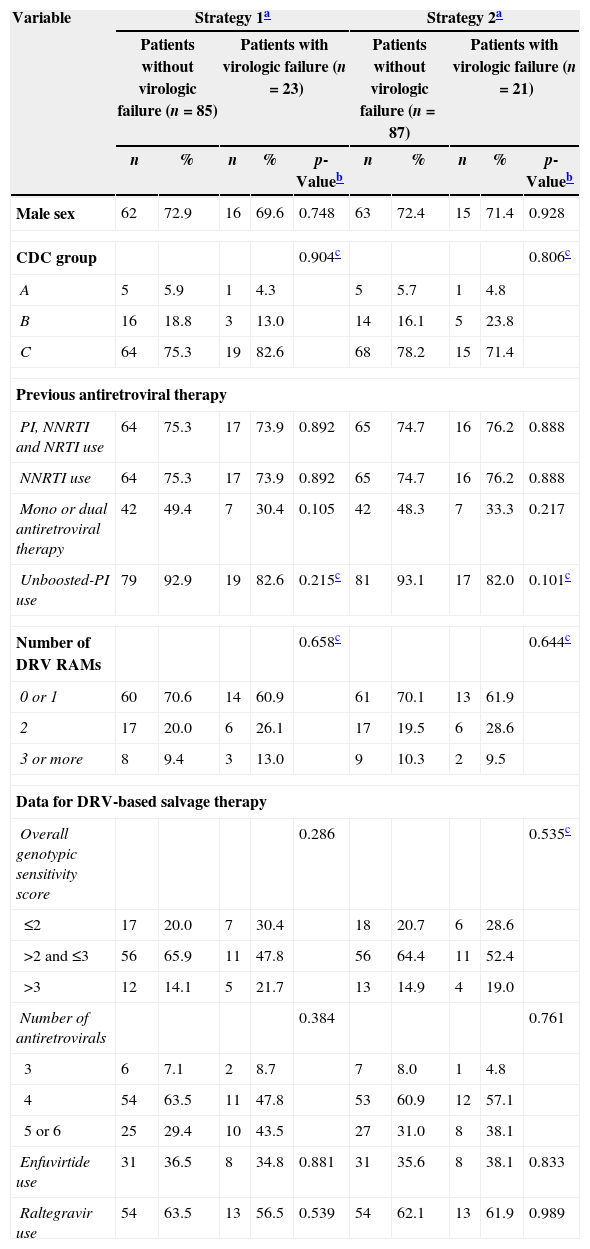
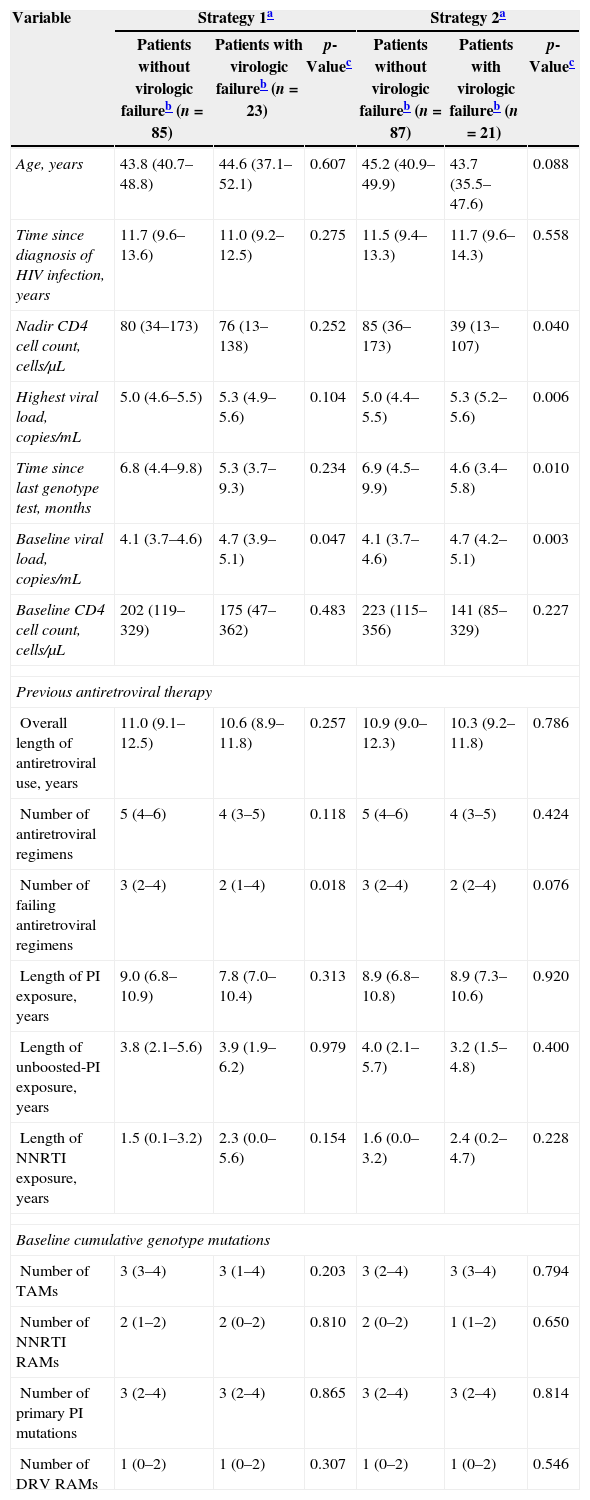
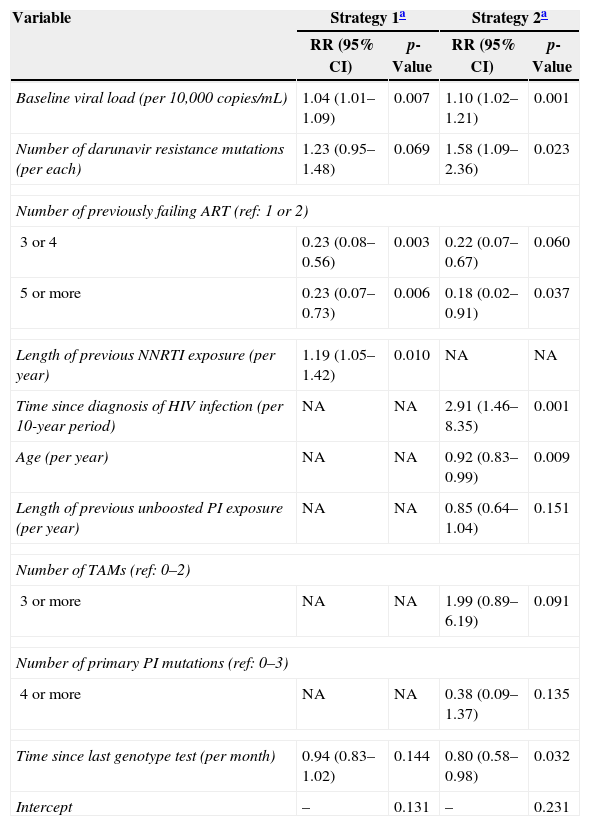
In univariate analysis, considering both strategies for handling missing data, higher baseline viral load, higher viral load at anytime, lower nadir CD4 cell count, and lower number of previous failing ARTs were independently associated with virologic failure (Tables 2 and 3). In multiple logistic regression models, irrespective of the strategy for handling missing data, higher viral load and higher number of DRV-RAMs were predictive of virologic failure. Conversely, use of a higher number of previous failing ARTs was associated with virologic success. Other variables associated with virologic failure were longer exposure to nonnucleoside reverse transcriptase inhibitors (NNRTI), longer time since HIV diagnosis, younger age, and shorter time since last genotype test, although their significance was more sensible to the strategy for handling missing data (Table 4).
Comparison of baseline patient characteristics (categorical data), according to virologic failure at week 48 (±4).
| Variable | Strategy 1a | Strategy 2a | ||||||||
|---|---|---|---|---|---|---|---|---|---|---|
| Patients without virologic failure (n=85) | Patients with virologic failure (n=23) | Patients without virologic failure (n=87) | Patients with virologic failure (n=21) | |||||||
| n | % | n | % | p-Valueb | n | % | n | % | p-Valueb | |
| Male sex | 62 | 72.9 | 16 | 69.6 | 0.748 | 63 | 72.4 | 15 | 71.4 | 0.928 |
| CDC group | 0.904c | 0.806c | ||||||||
| A | 5 | 5.9 | 1 | 4.3 | 5 | 5.7 | 1 | 4.8 | ||
| B | 16 | 18.8 | 3 | 13.0 | 14 | 16.1 | 5 | 23.8 | ||
| C | 64 | 75.3 | 19 | 82.6 | 68 | 78.2 | 15 | 71.4 | ||
| Previous antiretroviral therapy | ||||||||||
| PI, NNRTI and NRTI use | 64 | 75.3 | 17 | 73.9 | 0.892 | 65 | 74.7 | 16 | 76.2 | 0.888 |
| NNRTI use | 64 | 75.3 | 17 | 73.9 | 0.892 | 65 | 74.7 | 16 | 76.2 | 0.888 |
| Mono or dual antiretroviral therapy | 42 | 49.4 | 7 | 30.4 | 0.105 | 42 | 48.3 | 7 | 33.3 | 0.217 |
| Unboosted-PI use | 79 | 92.9 | 19 | 82.6 | 0.215c | 81 | 93.1 | 17 | 82.0 | 0.101c |
| Number of DRV RAMs | 0.658c | 0.644c | ||||||||
| 0 or 1 | 60 | 70.6 | 14 | 60.9 | 61 | 70.1 | 13 | 61.9 | ||
| 2 | 17 | 20.0 | 6 | 26.1 | 17 | 19.5 | 6 | 28.6 | ||
| 3 or more | 8 | 9.4 | 3 | 13.0 | 9 | 10.3 | 2 | 9.5 | ||
| Data for DRV-based salvage therapy | ||||||||||
| Overall genotypic sensitivity score | 0.286 | 0.535c | ||||||||
| ≤2 | 17 | 20.0 | 7 | 30.4 | 18 | 20.7 | 6 | 28.6 | ||
| >2 and ≤3 | 56 | 65.9 | 11 | 47.8 | 56 | 64.4 | 11 | 52.4 | ||
| >3 | 12 | 14.1 | 5 | 21.7 | 13 | 14.9 | 4 | 19.0 | ||
| Number of antiretrovirals | 0.384 | 0.761 | ||||||||
| 3 | 6 | 7.1 | 2 | 8.7 | 7 | 8.0 | 1 | 4.8 | ||
| 4 | 54 | 63.5 | 11 | 47.8 | 53 | 60.9 | 12 | 57.1 | ||
| 5 or 6 | 25 | 29.4 | 10 | 43.5 | 27 | 31.0 | 8 | 38.1 | ||
| Enfuvirtide use | 31 | 36.5 | 8 | 34.8 | 0.881 | 31 | 35.6 | 8 | 38.1 | 0.833 |
| Raltegravir use | 54 | 63.5 | 13 | 56.5 | 0.539 | 54 | 62.1 | 13 | 61.9 | 0.989 |
CDC, Centers for Disease Control; DRV, darunavir; NRTI, nucleoside reverse transcriptase inhibitor; NNRTI, nonnucleoside reverse transcriptase inhibitor; PI, protease inhibitor; RAMs, resistance-associated mutations.
Comparison of baseline patient characteristics (numerical data), according to virologic failure at week 48 (±4).
| Variable | Strategy 1a | Strategy 2a | ||||
|---|---|---|---|---|---|---|
| Patients without virologic failureb (n=85) | Patients with virologic failureb (n=23) | p-Valuec | Patients without virologic failureb (n=87) | Patients with virologic failureb (n=21) | p-Valuec | |
| Age, years | 43.8 (40.7–48.8) | 44.6 (37.1–52.1) | 0.607 | 45.2 (40.9–49.9) | 43.7 (35.5–47.6) | 0.088 |
| Time since diagnosis of HIV infection, years | 11.7 (9.6–13.6) | 11.0 (9.2–12.5) | 0.275 | 11.5 (9.4–13.3) | 11.7 (9.6–14.3) | 0.558 |
| Nadir CD4 cell count, cells/μL | 80 (34–173) | 76 (13–138) | 0.252 | 85 (36–173) | 39 (13–107) | 0.040 |
| Highest viral load, copies/mL | 5.0 (4.6–5.5) | 5.3 (4.9–5.6) | 0.104 | 5.0 (4.4–5.5) | 5.3 (5.2–5.6) | 0.006 |
| Time since last genotype test, months | 6.8 (4.4–9.8) | 5.3 (3.7–9.3) | 0.234 | 6.9 (4.5–9.9) | 4.6 (3.4–5.8) | 0.010 |
| Baseline viral load, copies/mL | 4.1 (3.7–4.6) | 4.7 (3.9–5.1) | 0.047 | 4.1 (3.7–4.6) | 4.7 (4.2–5.1) | 0.003 |
| Baseline CD4 cell count, cells/μL | 202 (119–329) | 175 (47–362) | 0.483 | 223 (115–356) | 141 (85–329) | 0.227 |
| Previous antiretroviral therapy | ||||||
| Overall length of antiretroviral use, years | 11.0 (9.1–12.5) | 10.6 (8.9–11.8) | 0.257 | 10.9 (9.0–12.3) | 10.3 (9.2–11.8) | 0.786 |
| Number of antiretroviral regimens | 5 (4–6) | 4 (3–5) | 0.118 | 5 (4–6) | 4 (3–5) | 0.424 |
| Number of failing antiretroviral regimens | 3 (2–4) | 2 (1–4) | 0.018 | 3 (2–4) | 2 (2–4) | 0.076 |
| Length of PI exposure, years | 9.0 (6.8–10.9) | 7.8 (7.0–10.4) | 0.313 | 8.9 (6.8–10.8) | 8.9 (7.3–10.6) | 0.920 |
| Length of unboosted-PI exposure, years | 3.8 (2.1–5.6) | 3.9 (1.9–6.2) | 0.979 | 4.0 (2.1–5.7) | 3.2 (1.5–4.8) | 0.400 |
| Length of NNRTI exposure, years | 1.5 (0.1–3.2) | 2.3 (0.0–5.6) | 0.154 | 1.6 (0.0–3.2) | 2.4 (0.2–4.7) | 0.228 |
| Baseline cumulative genotype mutations | ||||||
| Number of TAMs | 3 (3–4) | 3 (1–4) | 0.203 | 3 (2–4) | 3 (3–4) | 0.794 |
| Number of NNRTI RAMs | 2 (1–2) | 2 (0–2) | 0.810 | 2 (0–2) | 1 (1–2) | 0.650 |
| Number of primary PI mutations | 3 (2–4) | 3 (2–4) | 0.865 | 3 (2–4) | 3 (2–4) | 0.814 |
| Number of DRV RAMs | 1 (0–2) | 1 (0–2) | 0.307 | 1 (0–2) | 1 (0–2) | 0.546 |
DRV, darunavir; NNRTI, nonnucleoside reverse transcriptase inhibitor; PI, protease inhibitor; RAMs, resistance-associated mutations; TAM, thymidine-associated mutation.
Multiple logistic regression analysis of factors associated with virologic failure at week 48 (±4).
| Variable | Strategy 1a | Strategy 2a | ||
|---|---|---|---|---|
| RR (95% CI) | p-Value | RR (95% CI) | p-Value | |
| Baseline viral load (per 10,000 copies/mL) | 1.04 (1.01–1.09) | 0.007 | 1.10 (1.02–1.21) | 0.001 |
| Number of darunavir resistance mutations (per each) | 1.23 (0.95–1.48) | 0.069 | 1.58 (1.09–2.36) | 0.023 |
| Number of previously failing ART (ref: 1 or 2) | ||||
| 3 or 4 | 0.23 (0.08–0.56) | 0.003 | 0.22 (0.07–0.67) | 0.060 |
| 5 or more | 0.23 (0.07–0.73) | 0.006 | 0.18 (0.02–0.91) | 0.037 |
| Length of previous NNRTI exposure (per year) | 1.19 (1.05–1.42) | 0.010 | NA | NA |
| Time since diagnosis of HIV infection (per 10-year period) | NA | NA | 2.91 (1.46–8.35) | 0.001 |
| Age (per year) | NA | NA | 0.92 (0.83–0.99) | 0.009 |
| Length of previous unboosted PI exposure (per year) | NA | NA | 0.85 (0.64–1.04) | 0.151 |
| Number of TAMs (ref: 0–2) | ||||
| 3 or more | NA | NA | 1.99 (0.89–6.19) | 0.091 |
| Number of primary PI mutations (ref: 0–3) | ||||
| 4 or more | NA | NA | 0.38 (0.09–1.37) | 0.135 |
| Time since last genotype test (per month) | 0.94 (0.83–1.02) | 0.144 | 0.80 (0.58–0.98) | 0.032 |
| Intercept | – | 0.131 | – | 0.231 |
RR, relative risk; CI, confidence interval; ART, antiretroviral therapy; NNRTI, nonnucleoside reverse transcriptase inhibitor; NA, not applicable; PI, protease inhibitor; TAM, thymidine-associated mutation.
Twelve patients had previously used regimens containing fosamprenavir/r before DRV initiation. Patients with previous use of fosamprenavir/r had significantly more DRV-RAMs (median=1; p25–p75=0–2) than patients with no previous use (median=2; p25–p75=1–3) (p=0.016), although no significant univariate or multivariate association with 48-week virologic failure was observed.
DiscussionIn this study of HIV-1-infected patients who initiated a DRV-based salvage therapy, virologic success at week 48 was achieved by about 80% of patients and the mean CD4 cell count increase from baseline exceeded 100cells/μL. Higher baseline viral load (RR=1.04 per 10,000copies/mL increase; 95% CI=1.01–1.09) and higher number of DRV-RAMs (RR=1.23 per each; 95% CI=0.95–1.48) were independently associated with 48-week virologic failure.
Patients in our cohort had more advanced disease (CDC group C 76.9%) than patients who initiated a DRV-based salvage therapy in the POWER randomized trials (36%)11 and in a previous Brazilian prospective cohort from São Paulo (65%) published by Vidal et al.18 The proportion of patients with three or more primary protease inhibitor mutations was also higher that in the POWER trials (60.2% vs. 54%).11 Still, the proportion of patients with three or more DRV-RAMs (10.2%) was lower than in the POWER trials (22%)11 and higher than in the São Paulo cohort (7.6%).18 Another retrospective cohort from São Paulo by Schontag et al.19 reported a 15.3% prevalence of two or more DRV-RAMs, which is also significantly lower than in our cohort (31.5%). As for treatment history, the current cohort had less NNRTI exposure (75%), considering that in the POWER trials and São Paulo cohort all patients had received NNRTI.11,18 Despite the lower proportion of previous NNRTI use, our patients were highly exposed to unboosted protease inhibitors (90.8%) and mono or dual ART (45.4%), factors shown to be associated with virologic failure in previous studies.27,28
The proportion of patients with virologic success at week 48 in our study (about 80%) was higher than in the POWER trials (61%)11 but slightly lower than in the two Brazilian cohorts (82.6% and 84.7%).18,19 This may be mainly related to differences in the proportion of DRV-RAMs reported between studies. Differences in the composition of the OBT are also a likely explanation. All patients in the cohort of Vidal et al.18 received an OBT with at least one drug of a new class (enfuvirtide, raltegravir or maraviroc), while this proportion was only 82.4% in our cohort. In agreement with the high rate of virologic success, immunologic response was also significant. The estimated mean CD4 cell count increase from baseline varied between 107.7cells/μL and 131.5cells/μL, and was similar to the POWER trials (102cells/μL)11 and the study by Vidal et al. (118cells/μL).18
In multiple logistic regression analysis, higher baseline viral load was significantly predictive of virologic failure as in the subgroup analyses of TORO, BENCHMRK, DUET,10,14,29 and the previous Brazilian studies.18,19 In addition, higher number of DRV-RAMs were associated with virologic failure. This is in line with the POWER trials results, in which three or more DRV-RAMs were associated with a lower proportion of virologic success.11 In turn, the association found between longer duration of NNRTI exposure and virologic failure may be in part explained by the higher proportion of two-drug class resistance in patients exposed to a NNRTI-containing regimen when compared with those receiving a boosted protease inhibitor-based therapy.4
Unexpectedly, in the final logistic regression models, virologic failure was less likely in patients with three or more previous failing ARTs. This counterintuitive finding may reflect a prescription bias favoring patients with more previous failing ARTs. Indeed, in patients with two or less failing ARTs, the proportion of raltegravir and enfuvirtide use in the OBT was, respectively, 42.1% and 21.1%. In patients with three or four previous failing ARTs, these proportions were 71.2% and 40.4%, respectively. Evidence suggests that the improved antiviral activity of third-line drugs may overcome the poor treatment history of patients.11,13,14 This was illustrated in a study that showed lower rates of virologic failure over time in patients with triple-class failure, reducing from 80% in 2000 to 48% in 2007.27 Another reason for the improved virologic response among highly ART-experienced patients may be a higher level of adherence to ART as compared to patients with less previous ART exposure. A further explanation for this association could be a survivor bias.
Older age at baseline was also associated with higher virologic success. Higher adherence to ART in older HIV-1-infected patients, previously reported by some authors, may account for this finding.30–32
Due to the retrospective nature of our study, ART adherence could not be effectively measured. Accordingly, previous argumentations regarding ART adherence levels remain speculative.
The main limitation of this study was the presence of missing data on viral load and CD4 cell counts at week 48 (±4). This is a common problem in clinical research, even in well-designed randomized controlled trials, but is more frequent in observational studies with prolonged follow-up.33 In studies where efforts to avoid missing data failed, four different types of adjustment methods for analysis may be used: complete-case analysis, single imputation methods, estimating-equation methods, and methods based on a statistical model.33,34 However, there is no consensus about the best method for handling missing data in clinical studies.34,35 This is because all these methods are based on assumptions that, although scientifically plausible, are always empirically unverifiable.34 On the other hand, in these situations there is consensus that sensitivity analyses should be conducted to assess the robustness of the findings to plausible alternative assumptions about the missing data mechanism.34,36 In our study, we conducted sensitivity analysis by comparing two strategies for handling missing data (see “Materials and methods” section). It is worth noting that the rate of virologic success and the mean change in CD4 cell count were not highly sensitive to how missing values were treated. Regarding risk factors for virologic failure listed in Table 4, although they were less robust to the missing values assumptions, findings from both models are more complementary than conflicting.
In conclusion, virologic suppression is a realistic goal for most treatment-experienced HIV-1-infected patients who begin a DRV-based therapy even in routine care settings in Brazil.
Conflicts of interestThe authors declare no conflicts of interest.
