
The quantification of circulating Epstein–Barr virus (EBV) DNA is used to monitor transplant patients as an early marker of Post-Transplant Lymphoproliferative Disorders (PTLD). So far no standardized methodology exists for such determination.
ObjectiveOur purpose was to develop and validate a real-time PCR assay to quantify EBV DNA in clinical samples from transplant recipients.
MethodsA duplex real-time PCR method was developed to amplify DNA from EBV and from a human gene. The EBV load was determined in peripheral blood mononuclear cells (PBMC), plasma and oropharyngeal tissue from 64 non-transplanted patients with lymphoid-hypertrophy (Non-Tx), 47 transplant recipients without PTLD (Tx), 54 recipients with PTLD (Tx-PTLD), and 66 blood donors (BD). WinPEPI, version 11.14 software was used for statistical analysis.
ResultsAnalytical validation: the intra and inter-assays variation coefficients were less than 4.5% (EBV-reaction) and 3% (glyceraldehyde 3-phosphate dehydrogenase – GAPDH reaction). Linear ranges comprised 107–10 EBV genome equivalents (gEq) (EBV-reaction) and 500,000–32 human gEq (GAPDH-reaction). The detection limit was 2.9 EBV gEq (EBV-reaction). Both reactions showed specificity. Application to clinical samples: higher levels of EBV were found in oropharyngeal tissue from transplanted groups with and without PTLD, compared to Non-Tx (p<0.05). The EBV load in PBMC from the groups of BD, Non-Tx, Tx and Tx-PTLD exhibited increasing levels (p<0.05). In BD, PBMC and plasma, EBV loads were undetectable.
ConclusionsThe performance of the assay was suitable for the required clinical application. The assay may be useful to monitor EBV infection in transplant patients, in particular in laboratories from low-income regions that cannot afford to use commercial assays.
The quantification of Epstein–Barr virus (EBV) peripheral DNA is used to monitor transplant patients as an early marker of Post-Transplant Lymphoproliferative Disorders (PTLD).1–3 It has been proven that EBV load in peripheral blood samples from transplant patients with PTLD is higher than in transplant recipients without this disorder.4–6 Along the last decade, different quantitative PCR assays (semi-quantitative, competitive, real-time) have been used for surveillance, diagnosis, monitoring response to treatment, and determination of the degree of immunosupression to be applied. So far, there is no reference strategy to determine EBV load, including for instance the calibrator, the EBV region to be amplified, or the best sample type for identifying PTLD risk.7,8
No international standards were available until 2012, when the World Health Organization introduced the first WHO International Standard for Epstein–Barr virus, intended to be used for nucleic acid amplification techniques.9 Thus, the literature describes a variety of controls used to analytically validate EBV quantification assays, including cell lines,10–12 plasmids with EBV-genome fragments inserted,13,14 and commercially available controls containing viral particles.15,16 As no international standard or consensus-accepted control have been developed,17–19 each laboratory decided what calibrator to use to validate its own EBV quantification method. Different fragments of EBV genes were chosen for amplification in a variety of quantification assays, including repeated (BamHI-W region) or single (EBERs, EBNA-1, LMP-2, etc) viral genome regions20,21 with different degrees of sensitivity or accuracy, as previously described.22,23 Moreover, several blood sample types (peripheral blood mononuclear cells, plasma, and whole blood) were analyzed to identify PTLD. Most studies described and/or recommended using cell-associated blood samples over plasma/serum, but both specimen types appear to be informative and each laboratory determines its preference.24,25 Also, the extraction methods, the amount of sample to be analysed, the report format and the characteristics of the study populations vary between published data.7,20,21 Thus, all these factors have affected the comparison between methods.
Several years ago, our laboratory developed a semiquantitative PCR strategy to measure EBV load26 and since then it has been used to monitor this viral infection in transplanted population from most of the institutions that perform organ transplantation in Argentina. The method is quite cumbersome and time-consuming; results demand at least 48hours. Currently, real-time PCR quantification methods are widely applied to assess EBV load due to their advantages over conventional PCR assays.3,7,21 Moreover, the simultaneous amplification of an internal control along with the target DNA is widely used to detect the presence of inhibitors; it also allows to quantify the amount of sample present in the reaction, which permits viral load normalization.10,27
Despite the current availability of commercial assays, many laboratories from low income regions are unable to afford them; thus, less-costly in-house methods may be the only option to monitor EBV load in transplant patients. Their development and validation could be extremely useful for the prevention of PTLD in these settings.
Therefore, the aim of the present study was to develop and analytically validate a duplex real-time PCR assay to quantify EBV and human DNA in different types of clinical samples, in order to determine the EBV load in transplant patients regarding the risk of PTLD.
Materials and methodsPatients and samplesChildren treated in “Prof. Dr Juan P. Garrahan” Pediatric Hospital, Austral University Hospital, “Sor María Ludovica” Children's Hospital” and Favaloro Foundation, and blood donors of the “J. F. Muñiz” Infectious Diseases Hospital were included as follows:
- (A)
64 non-transplanted patients with lymphoid hypertrophy in the oropharyngeal tissue.
- (B)
101 solid organ transplant patients (75 liver, 24 kidney, 2 heart), 54 of them with histological diagnosis of PTLD (including categories 1, 2, 3 and 4), according to the World Health Organization: IARC, 2008.28
- (C)
66 blood donors, with negative results for all infections screened in routine blood bank protocol (hepatitis C virus, hepatitis B virus, human T lymphotropic virus I/II, human immunodeficiency virus, syphilis, brucellosis, and Chagas¿ infection).
All patients were infected with EBV according to the presence of IgG antibodies against viral capsid antigen (VCA) and/or viral DNA in peripheral blood.
Patients in the transplant group were on an immunosuppressive regimen consisting of cyclosporine, tacrolimus or sirolimus, azathioprine or mycophenolate mofetil and steroids.
Peripheral blood and oropharyngeal lymphoid tissue samples were taken due to oropharyngeal lymphoid hypertrophy, following the treatment protocol for transplant and non-transplanted patients. An informed consent was obtained in all cases as per the Helsinki declaration and other national and international regulations.
Peripheral blood mononuclear cells (PBMC) and plasma were separated from 2.5 to 5mL of EDTA-anticoagulated whole blood samples by centrifugation on a density gradient (Histopaque-1077, Sigma–Aldrich) and stored at −20°C. Oropharyngeal lymphoid tissue samples obtained through surgical removal from patients with lymphoid hypertrophy were stored at −80°C.
Controls and Calibrators
- -
EBV-specific reaction (EBNA-1 reaction)
A plasmid containing a deleted fragment of the EBNA-1 coding gene from the EBV genome was used as calibrator of the real-time PCR quantification method. It had been previously developed in our laboratory to be used as competitor in a quantitative competitive PCR. It was quantified by spectrophotometry at 260nm and stored at −80° C.
Calibrators were generated to exhibit the same characteristics as the clinical samples. Thus, for the EBNA-1 reaction, two types of calibrators were prepared:
- A
Calibrators representative of cell-associated samples (peripheral blood mononuclear cells, tissues): serial dilutions of the PEBNA-1 were performed and placed on a background of 366ng of commercially available human DNA (equivalent to 105 human cells).26
- B
Calibrators representative of cell-free samples (plasma/serum): serial dilutions of the PEBNA-1 were performed without the human DNA background.
This allowed studying seven levels of EBV genome equivalents: 107, 106, 105, 104, 103, 102 and 10 for each type of calibrator.
- -
- -
Human-specific reaction (GAPDH-reaction)
Commercially available human DNA was used as a positive control for the glyceraldehyde 3-phosphate dehydrogenase (GAPDH) reaction (Human Genomic DNA, Roche); which was quantified by spectrophotometry at 260nm, aliquoted and stored at −80° C.
Thus, seven calibrators were generated by 1/5 dilution of the commercially available human control, representing: 5×10⁵, 105, 2×10⁴, 4×10³, 8×10², 160 and 32 human cells. All these DNA concentrations were analyzed in the presence of high (106 EBV genome equivalents) or low (10 EBV genome equivalents) amounts, or in absence of the control PEBNA-1.
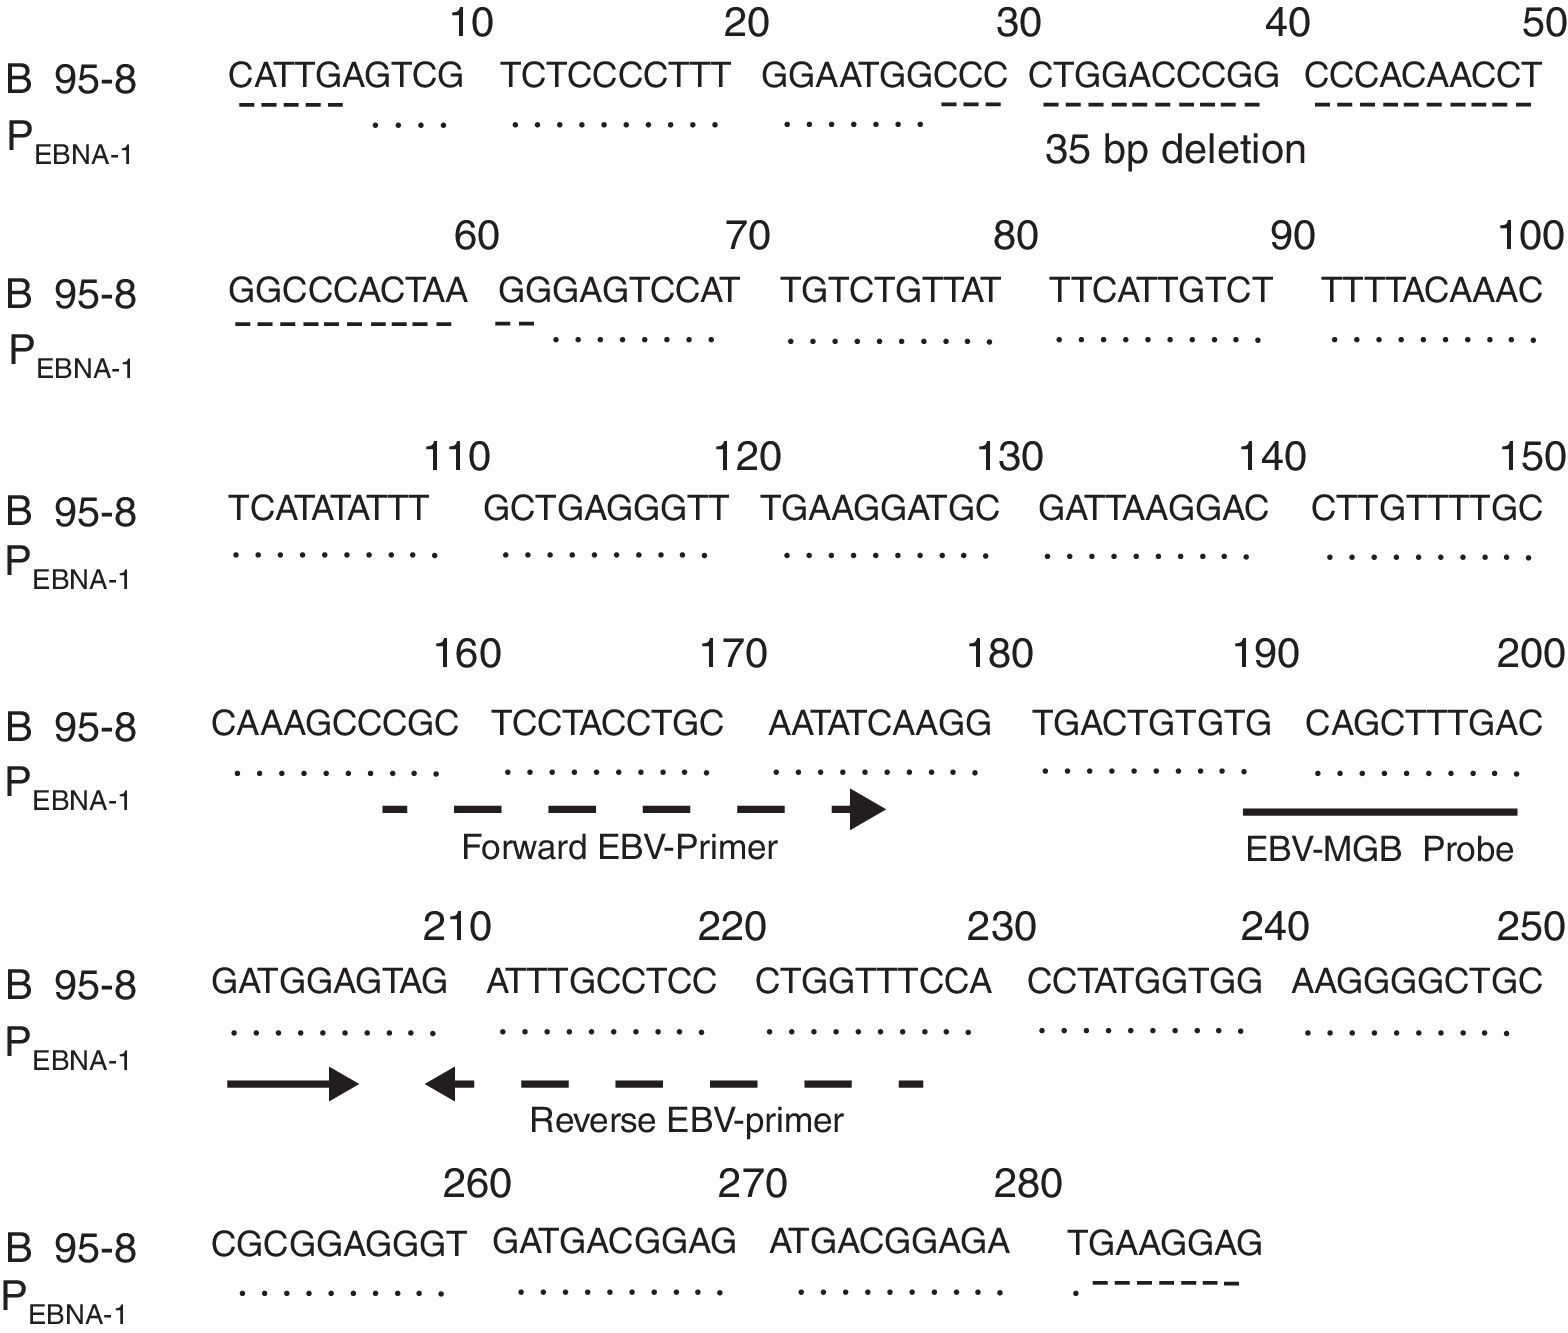
PEBNA-1 sequencingPEBNA-1 was characterized by sequencing with the BigDye Terminator Sequencing kit v3.1, according to manufacturer's recommendations in the Genetic Analyzer 3500 (Applied Biosystems-Hitachi). The sequence analysis was performed using the Sequencing Analysis Software v5.2 (Applied Biosystems). The PEBNA-1 sequence was compared with that of the prototypic EBV strain, B95-8, applying the BioEdit Sequence Alignment editor v7.0.9.
DNA extractionDNA from PBMC and oropharyngeal tissue samples was extracted as previously described.26
Plasma DNA was extracted using the QIAmp DNA mini kit (QIAgen) according to manufacturer's instructions, taking into account the suggested recommendations for free viral DNA extraction.
Real-time PCR method for EBV DNA quantificationA duplex real-time PCR strategy that simultaneously amplifies portions of the EBV and of the human genome was applied, encoding the EBNA-1 protein and the glyceraldehyde 3-phosphate dehydrogenase (GAPDH) enzyme respectively.
For the primers/probe design, the Primer Express software 2.0 (Applied Biosystems) was applied on the sequence of the PEBNA-1 to obtain MGB (Minor Groove Binding) type primers/probe, for the EBNA-1-reaction and on a conserved portion of the reference sequence of human GAPDH (AC 000144, GenBank) to obtain TAMRA (tetramethylrhodamine) type primers/probe for the GAPDH-reaction. In both cases, a pair of primers and probe for each reaction was selected, taking into account the most favourable condition with respect to their score and secondary structure; also, the possibility of non-specific cross-reactions was ruled out by analyzing their sequences with the Basic Local Alignment Search Tool (BLAST). The selected primers/probes were as follows: EBNA-1 reaction: 5′ CCGCTCCTACCTGCAATATCA 3′ (forward primer) and 5′ GGAAACCAGGGAGGCAAATC 3′ (reverse primer); 5’ VIC-TGCAGCTTTGACGATGG-MGB 3’ (probe). They amplified a 73 base pair fragment.
GAPDH reaction: 5′ GGTGGTCTCCTCTGACTTCAACA 3′ (forward primer); 5′ GTGGTCGTTGAGGGCAATG 3′ (reverse primer) and 5′ FAM-CCACTCCT CCACCTTTGACGCTGG-3′ TAMRA (probe). They amplified a 79 base pair fragment.
Amplification was performed in a final reaction volume of 25μl, containing 1X TaqMan Universal Master Mix with AmpErase UNG (Applied Biosystems), 0.3μM of EBV-primers, 0.05uM of GAPDH-primers, 0.1μM of EBV-probe and GAPDH-probe and the DNA to be amplified (calibrators for EBV or GAPDH reactions as described, 366ng (equal to 105 cells) of DNA from PBMC or oropharyngeal tissue or a volume of DNA extracted from plasma (representing 30μl of plasma). The amplification was carried out using the 7500 real-time PCR System (Applied Biosystems) and the cycle conditions were as follows: 50°C 2min; 95°C 10min, followed by 45 cycles of 95°C 15s, 60°C 1min.
The EBV load in PBMC DNA was expressed as the number of EBV genome equivalents per 105 PBMC. The normalized EBV load was estimated from the results of the EBNA-1 and GAPDH reactions (105×EBNA-1 load/GAPDH load) and the unnormalized load from the result of the EBNA-1 reaction when measuring 366ng of PBMC DNA estimated by spectrophotometry. The plasma EBV load was expressed as the number of EBV genome equivalents per mL of plasma multiplying the EBNA-1 reaction result by a factor of 33.3 (considering that the amount of plasma analyzed was 30μL, thus 30μL×33.3=1000μL).
Analytic validationMaster batches of all controls and reagents were prepared for the analytical validation.
The precision and dynamic range of the EBNA-1 and GAPDH reactions were determined in a one-day-run, with four replicates of each set of seven calibrators described over 20 consecutive days. The intra-assay (repeatability) and inter-assay (precision) variations were calculated using the CLSI/NCCLS. 2005. EP15-A2 procedure.29 The linear range was analysed using polynomial regression according to the CLSI/NCCLS. 2003. EP6-A procedure.30
The EBNA-1 reaction detection limit was determined using series of four samples prepared by diluting a high concentration EBV control (PEBNA-1) to dilutions containing 1, 2, 4 and 8 copies of EBV genome equivalents, either in a background of human DNA representing 105 cells (366ng) or without the DNA background. Twenty replicates of each sample were tested in three different runs. The detection limit was calculated using the probit regression function.
The amplification efficiency of each run was calculated using the following formula: E=(10−1/m−1)×100.31
To analyze EBNA-1 reaction specificity, DNA from the Epstein–Barr virus (PEBNA-1 and RAJI cell line), from the human members of the Herpesviridae family (herpes simplex virus, cytomegalovirus, varicella-zoster virus, human herpesvirus 6 and human herpesvirus 8), from different origin human cells (fibroblast, human embryonic kidney (HEK-293) cell lines) and commercial source human DNA (Human Genomic DNA, Roche) were analysed. To analyze GAPDH reaction specificity, DNA from human cell lines (HEK-293 and human fibroblast), commercial source human DNA and plasmids containing different herpesvirus sequences (herpes simplex, varicella-zoster, cytomegalovirus, and human herpesvirus 6) were studied.
Statistical analysisThe precision box-plot, dose response curve and regression analysis were performed with Microsoft Excel 2003. WinPEPI version 11.14 software was used for statistical analyses. Medians and confidence intervals were obtained with Describes, version 2.33. Differences between medians of continuous variables were analyzed using the Mann–Whitney or Kruskal–Wallis test for two groups (program Compare 2, version 2.57) or more than two groups (Etcetera, version 2.56). p-Values below 0.05 were considered significant.
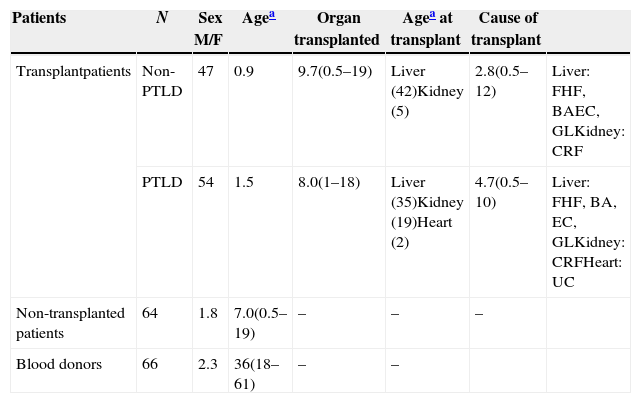
ResultsDescription of the study populationThe population characteristics are described in Table 1.
Description of the patients.
| Patients | N | Sex M/F | Agea | Organ transplanted | Agea at transplant | Cause of transplant | |
|---|---|---|---|---|---|---|---|
| Transplantpatients | Non-PTLD | 47 | 0.9 | 9.7(0.5–19) | Liver (42)Kidney (5) | 2.8(0.5–12) | Liver: FHF, BAEC, GLKidney: CRF |
| PTLD | 54 | 1.5 | 8.0(1–18) | Liver (35)Kidney (19)Heart (2) | 4.7(0.5–10) | Liver: FHF, BA, EC, GLKidney: CRFHeart: UC | |
| Non-transplanted patients | 64 | 1.8 | 7.0(0.5–19) | – | – | – | |
| Blood donors | 66 | 2.3 | 36(18–61) | – | – |
Fig. 1 shows the result of the analysis of the EBV fragment sequence inserted in PEBNA-1 compared with that of the B95-8 prototype strain, according to which both fragments were identical except for the 35bp deletion.
Analytic validation of the real-time PCR EBV quantification assay and probe (—) used in the EBV-specific real-time PCR reaction are indicated.")
- -
Precision
.")
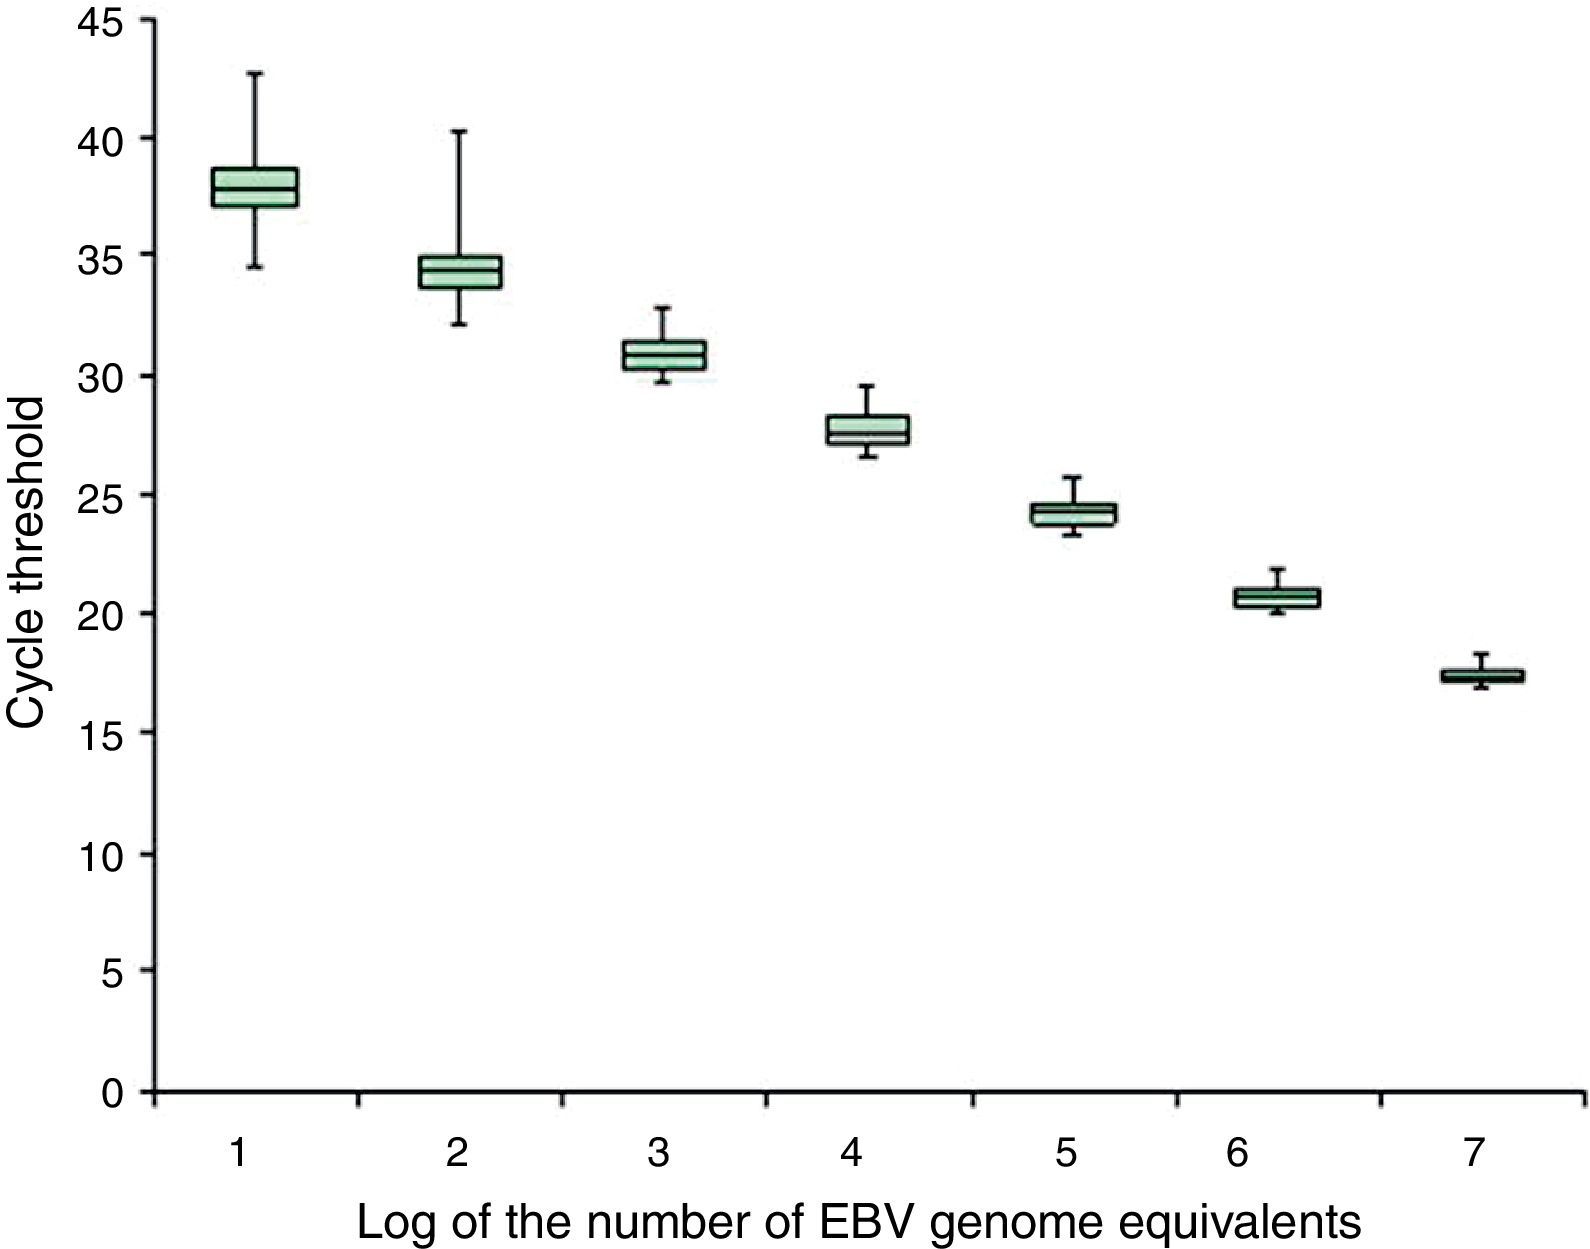
Precision box plot according to the EBV calibrators representative of cell-associated samples. The box plot shows the median, first and third quartiles of the cycle thresholds obtained for the EBV calibrators representative of cell-associated samples during the analytical validation; the minimum and maximum values are indicated (–).
No differences were observed in the cycles’ threshold results obtained by the EBNA-1 reaction between the calibrators representing cell-associated samples or cell-free samples (data not shown). For the GAPDH reaction, the intra- and inter-run variation coefficients were less than 3%, at all concentrations studied (data not shown).
- -
Linear range
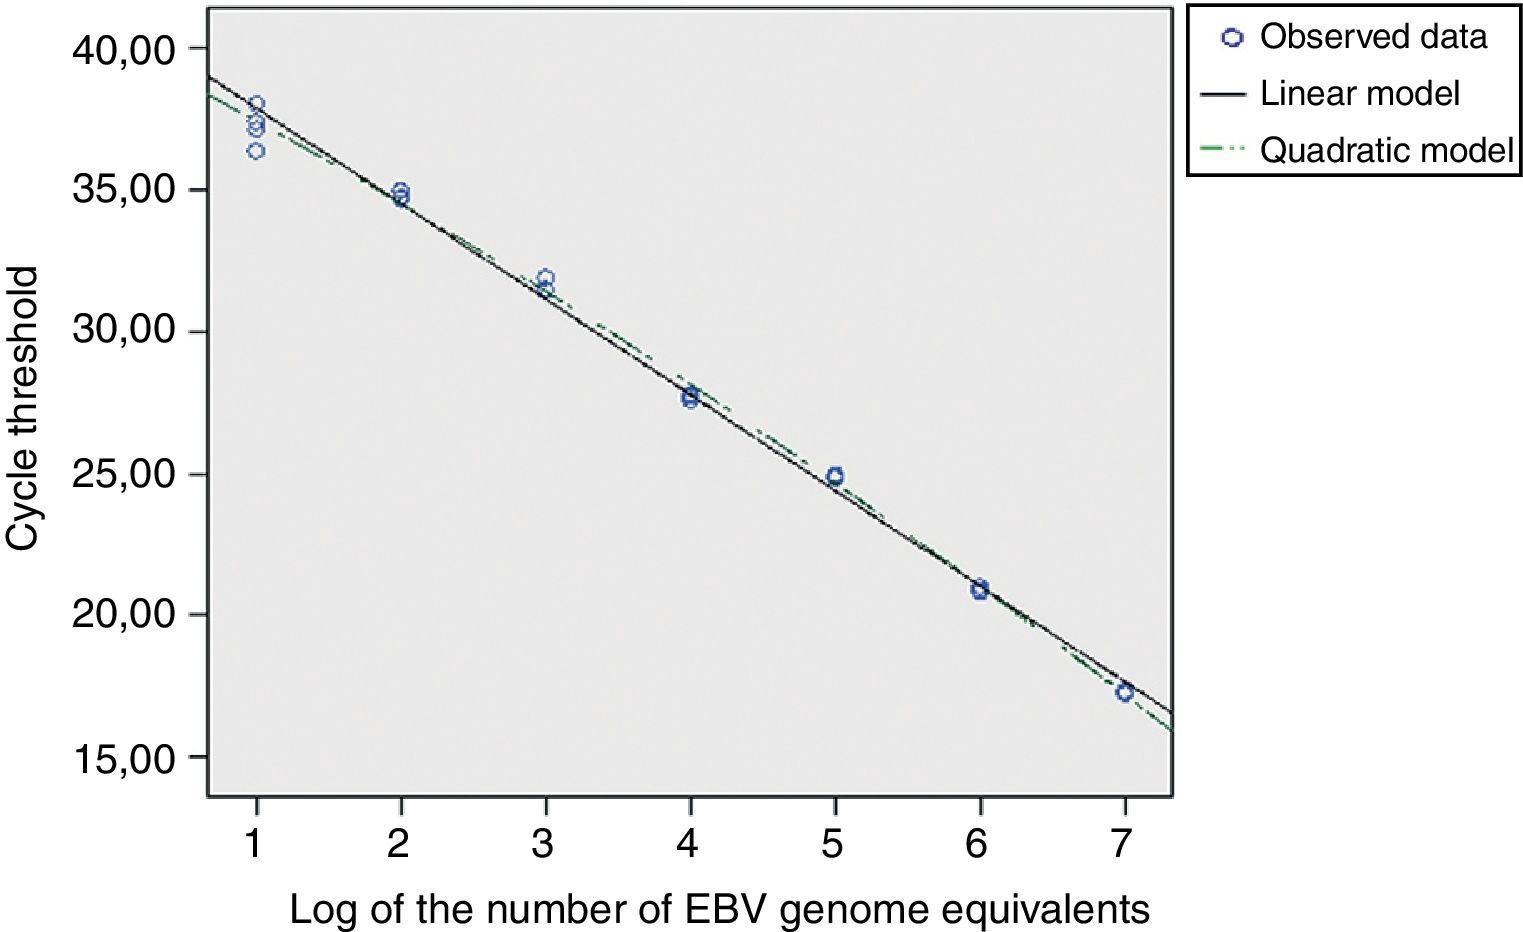
For the EBNA-1 reaction, the cycles thresholds’ regression analysis, obtained from the EBV calibrators, was applied to determine the linear range (Fig. 3). The standard error of the regression (taken as a measure of the model adjustment) was not higher than those for the second and third order models; it was concluded that the best match for this data set was the linear order model. Thereby, the reaction showed linearity across the whole range of concentrations studied (between 107 and 10 EBV genome equivalents), both for cell-associated and cell-free calibrators.

A similar analysis for the GAPDH reaction showed a linear range between 500,000 and 32 human genome copies (data not shown). No differences were noted in the reaction results at all human DNA levels studied either in absence or presence of low or high concentrations of EBV genome equivalents (data not shown).
- -
Detection limit
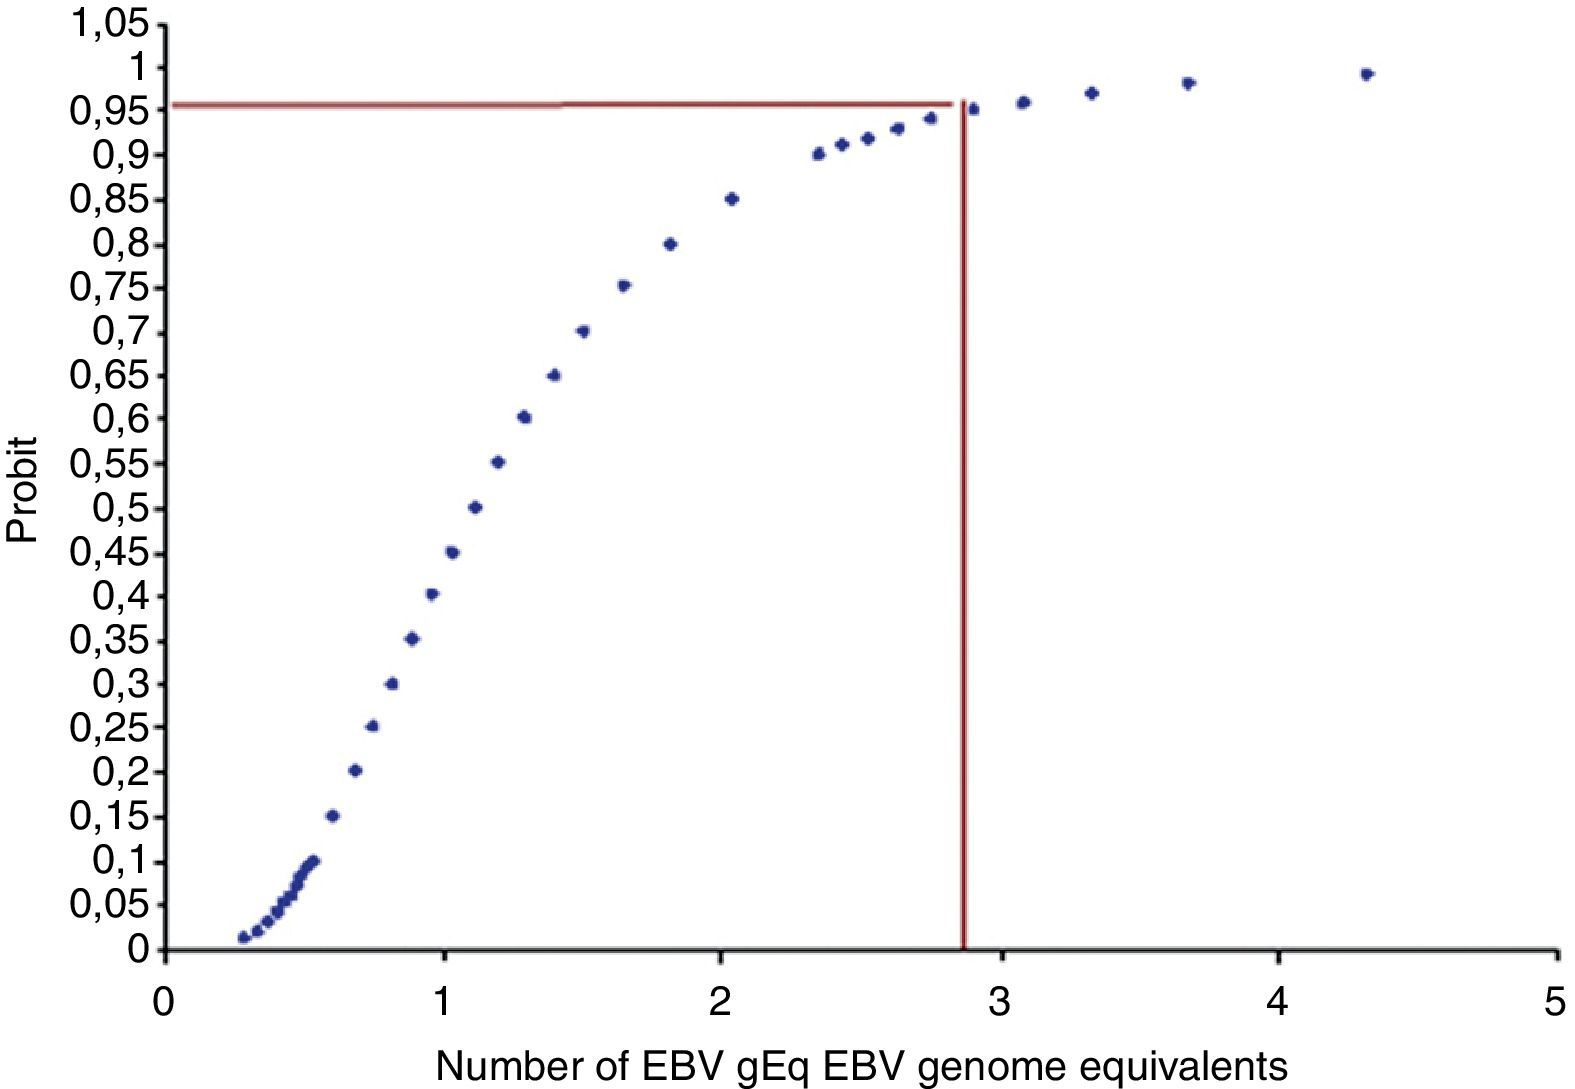
Fig. 4 shows the minimum concentration of EBV genome equivalents of the calibrator representing the cell-associated samples that could be readily detected.

The probit regression analysis showed that the detection limit is about three EBV genome equivalents per 105 cells. A similar detection limit was obtained for calibrators representing cell-free samples.
The GAPDH-reaction detection limit was not studied since the determination of the EBV load requires analysing close to 105 cells DNA (equivalent to 366ng) from each sample. A very low amount of initial DNA may result from errors in loading the sample, DNA quality, or the presence of inhibitors; in all such cases the assay must be repeated.
- -
Efficiency
Both in the analytical validation and when studying the clinical samples, an amplification efficiency of 90–110% for both reactions was required in order to consider that an assay was acceptable.
- -
Specificity
When analysing the EBNA-1 reaction, a positive signal was only seen with the EBV controls’ DNA; no amplification was detected when analysing DNA from other human members of the Herpesviridae family (herpes simplex virus, cytomegalovirus, varicella-zoster virus, human herpesvirus 6 and human herpesvirus 8) or from human origin. Moreover, the GAPDH reaction gave a positive signal with different human DNAs but no signal with plasmid or various Herpesvirus (herpes simplex virus, cytomegalovirus, varicella-zoster virus and human herpesvirus 6) DNAs.
Correlation of normalized and unnormalized EBV loads measured in PBMC DNAThe results of the EBV load measured in PBMC DNA representing 105 cells estimated by spectrophotometry (equal to 366ng) (unnormalized load) and the GAPDH-reaction (normalized load) showed a linear correlation (data not shown). In some cases, when the amount of DNA was measured by spectrophotometry (performed prior to the amplification reaction), the amount of DNA was underestimated.
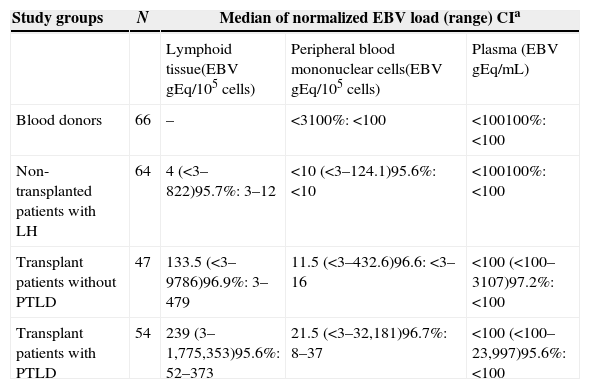
EBV load in different clinical states and kinds of samplesIn order to analyse the differences in the EBV load between transplant and non-transplanted patients in various clinical situations, we compared the following groups: blood donors (healthy carriers), individuals with lymphoid tissue hypertrophy, organ-recipients who did not develop PTLD and transplant patients with histological diagnosis of PTLD. In the blood donors group, only compartments of peripheral blood mononuclear cells and plasma were studied, since lymphoid tissue samples were not available (Table 2).
- -
Lymphoid tissue
EBV viral load measure in different virus persistence sites.
| Study groups | N | Median of normalized EBV load (range) CIa | ||
|---|---|---|---|---|
| Lymphoid tissue(EBV gEq/105 cells) | Peripheral blood mononuclear cells(EBV gEq/105 cells) | Plasma (EBV gEq/mL) | ||
| Blood donors | 66 | – | <3100%: <100 | <100100%: <100 |
| Non-transplanted patients with LH | 64 | 4 (<3–822)95.7%: 3–12 | <10 (<3–124.1)95.6%: <10 | <100100%: <100 |
| Transplant patients without PTLD | 47 | 133.5 (<3–9786)96.9%: 3–479 | 11.5 (<3–432.6)96.6: <3–16 | <100 (<100–3107)97.2%: <100 |
| Transplant patients with PTLD | 54 | 239 (3–1,775,353)95.6%: 52–373 | 21.5 (<3–32,181)96.7%: 8–37 | <100 (<100–23,997)95.6%: <100 |
PTLD, post-transplant lymphoproliferative disorders; CI, confidence interval; EBV gEq, EBV genome equivalents; LH, lymphoid hypertrophy.
In non-transplanted patients with oropharyngeal lymphoid hypertrophy, EBV DNA was detectable in 70.3% of the lymphoid tissue samples (≥3 EBV genome equivalents/105 cells) and quantifiable in 37.5% (≥10 EBV genome equivalents/105 cells). In transplant patients without PTLD, EBV DNA was detectable and quantifiable in 85.0% and 65.0% of samples, respectively; while in PTLD cases, the values increased to 100% and 87.1%, respectively. Significantly higher levels of EBV were found in oropharyngeal tissue from transplanted groups with and without PTLD, compared to non-transplanted patients (p<0.05), but there was no difference between transplant recipients with and without PTLD (p>0.05).
- -
Peripheral blood mononuclear cells
In blood donors, 100% of the PBMC samples’ DNA showed undetectable EBV DNA levels; in non-transplanted patients with oropharyngeal lymphoid tissue hypertrophy, 61.2% of the DNA obtained from PBMC samples carried detectable (≥3 EBV genome equivalents/105 PBMC) and 24.5% quantifiable (≥10 EBV genome equivalents/105 PBMC) EBV load; in transplant patients without PTLD, 65.8% of the PBMC samples showed detectable EBV DNA and 42.1% quantifiable levels, and in organ recipients with PTLD, 97.9% of PBMC samples showed detectable EBV DNA which in 64.6% was quantifiable. The EBV load in PBMC from the groups of blood donors, non-transplanted individuals, transplanted groups with and without PTLD showed significantly increasing levels (p<0.05).
- -
Plasma
In three transplant patients, the GAPDH reaction was negative, indicating inhibition or absence of plasma-extracted DNA; those were excluded from the analysis. In 100% of the plasma samples from blood donors and non-transplanted patients with lymphoid hypertrophy, EBV DNA was not detectable. In transplant patients without PTLD, viral DNA was detectable (≥100 EBV genome equivalents/mL) in 11.9% and quantifiable (≥333 EBV genome equivalents/mL) in 4.8% of the samples tested; in transplant recipients with PTLD, EBV DNA was detectable in 23.2% and quantifiable in 21.4% of the samples. In the plasma compartment no significant EBV load difference was detected between transplant recipients with and without PTLD (p>0.05).
DiscussionThe above described method was designed to detect viral loads higher than those found in the peripheral blood of healthy carriers. Thus, we decided to analyze a DNA amount equivalent to 105 human cells from each transplant patient, as already described.26 Since the cell quantification methods available were not very reproducible, instead of cells, we preferred to quantify the cellular DNA by either spectrophotometry or co-amplification of human GAPDH gene. When comparing the normalized and unnormalized EBV loads, a more accurate estimation of the PBMC DNA quantity resulted from the GAPDH reaction than from the spectrophotometrical measurement. This could probably be explained because the quantification of human and EBV DNA is made in the same tube in the real-time PCR assay, while the spectrophotometry quantification is done prior to the amplification reaction and pipetting or dilution errors are therefore disregarded. Thus, the EBV load normalization may allow for better comparison between samples from different individuals or from the same patient taken at different times.
The above described EBV quantification method proved to be linear in a wide range of concentrations for both reactions. In the case of the EBNA-1 reaction, the EBV DNA concentrations expected in clinical samples may vary from concentrations similar to those seen in healthy carriers (undetectable with this methodology) to very high levels as those of transplant patients with neoplastic PTLD.3,20 Therefore, this reaction's linear range is appropriate for the required clinical purposes. On the other hand, the GAPDH-reaction also showed a broad dynamic range; however, in this case, the expected amount of DNA to be analyzed in each clinical sample may vary less since the DNA quantity is previously determined by spectrophotometry. Besides, it should be mentioned that by using DNA from PBMC obtained from a fixed blood volume, variations between different sample amounts will depend on the differences in PBMC concentration. Since solid organ transplant patients usually exhibit normal leukocyte counts (between 5000 and 11,000 cells per μl), the expected variation between samples may be small. Thus, the GAPDH reaction dynamic range is also suitable for the purpose of the assay.
The obtained intra- and inter-assay variation coefficients matched the criteria established for this method and were also consistent with published data.22,23,27 Moreover, the accuracy levels were adequate for clinical applications, i.e. monitoring EBV DNA levels in transplant patients, in which a small variation may be informative.32,33 Also, since the method was developed for patients infected with EBV, with emphasis on those carrying high amounts of circulating viral copies, the detection limit obtained was appropriate for clinical purposes and coincided with that described in other studies.22,23,34
In this context, the present study analyzed EBV DNA levels in different types of clinical specimens representing viral persistence sites35 and various clinical situations. Thus, the EBV load obtained in oropharyngeal tissue from the group of non-transplanted patients was similar to previously described data.36,37 Moreover, among the limited literature describing EBV levels in tonsils, slightly higher load values than those found in this study have been reported.38,39 These differences could be explained by the way of expressing the result: mean38 vs. median (present study), or may be due to the different amplified genomic fragments: the repeated BamHI-W region39 vs. the single EBNA-1 region (present study). Also, the median EBV load obtained from the transplanted group without PTLD exhibits a wide range, which could be divided into two subgroups of patients: one with viral loads similar to those seen in non-transplanted patients and the other with higher loads. It should be mentioned that two subgroups –“low-load carriers” and “high-load carriers” – had been previously differentiated by measuring EBV in DNA from peripheral mononuclear cells of transplant recipients without PTLD.40,41 According to our results, those descriptions coincide with findings in the oropharyngeal lymphoid tissue of transplant patients.
Otherwise, the EBV load measured in PBMC was undetectable in all blood donors, i.e. lower than that described in a similar control group.27 This difference could be due to the initial DNA quantity that was amplified (around 3-fold larger than in this study). In addition, in this report both in plasma and PBMC from blood donors and in plasma from children with oropharyngeal lymphoid hypertrophy, EBV loads were consistent with previously described viral levels.15,16,42,43
In transplant patients, the increased EBV load reported in the literature in comparison with healthy carriers is variable. In this study, the ranges of EBV DNA load in PBMC from transplant patients without PTLD were similar to previously informed data,12,35,44,45 albeit more limited than in other reports.27 The difference could be explained by the characteristics of the study groups: adults receiving heart transplantation,27 while in this work the transplanted group without PTLD were children, mainly liver and kidney transplantation recipients. The degree of immunosuppression used after heart transplantation is more pronounced than after kidney and liver transplantation.2,46 Furthermore, the higher the dose of immunosupressive drugs applied, the more likely the occurrence of viral activation which results in larger EBV loads.
In transplant patients with EBV-associated PTLD, high levels of EBV DNA have often been reported, measured in the cellular fraction and plasma of peripheral blood. However, the number of EBV copies reported by different authors varies.3,7,8 In this work, the median EBV loads and their range in PBMC from transplant patients with PTLD showed the highest levels of EBV DNA. Nevertheless, the EBV load ranges were very wide and included almost 35% of the EBV loads below 10 EBV genome equivalents, which correspond to patients with early PTLD stages (data not shown). Thus, some PTLD cases have shown EBV levels in PBMC lower than those described in the literature. The disagreements could be explained by differences in the methodological strategies applied and also because a larger number of cases with early PTLD stages were analyzed in this report.
The EBV load ranges in plasma samples from the transplanted group without PTLD were similar to the already described data,15,44,47 whereas in transplant patients with PTLD, the higher EBV levels resembled previously obtained information,44 but were lower, or the ranges narrower than those described by other authors.15,22,47,48 It has been noted that most of the PTLD patients had undetectable viral DNA levels in plasma; this is consistent with reports of transplant patients with EBV-associated pathology.49 Nevertheless, the differences in the levels of EBV plasma loads between this study and others can be explained by the different methodologies and also by the PTLD category analyzed. Most reports studied only patients diagnosed with neoplastic-PTLD.15,22,47,48
An EBV International Standard has recently been made available9; the present results agree with previous reports on the convenience of its use to validate quantification EBV assays, and emphasize the need for a reference methodological strategy to measure EBV loads (calibrator, method, type of clinical sample, and cut-off values).
Finally, while commercial assays may improve standardization, they are more expensive than in-house assays. On the other hand, in-house assays may lack validation and require additional efforts to standardize. These last attempts may be especially suitable for low-resource settings, where an in-house assay could mean the only affordable alternative for some laboratories to monitor PTLD risk in transplant recipients. Thus, an assay with a detailed analytical validation that follows the International Organization for Standardization (ISO) guidelines may represent a very attractive alternative for low resource laboratories when assessing its possible implementation
ConclusionsThis real-time PCR quantification assay could be used to follow EBV infection in transplant patients. Its performance matched the required clinical applications. In addition, it was proven to detect EBV DNA levels higher than those found in the peripheral blood compartment (PBMC and plasma) of blood donors, as those described in the transplanted population. It may be useful to differentiate transplant patients with and without PTLD in different clinical samples. Furthermore, it could be used for the clinical management of other EBV-associated diseases. This in-house methodology translate into a less expensive and more accessible alternative than commercial EBV load assays, especially valuable for laboratories in low income regions.
Also, taking into account the results obtained in the transplanted population and the data reported, the analysis of EBV loads in transplant patients with different PTLD stages could be useful in identifying the best way to detect PTLD risk.
Authors’ contributionsAll authors read and approved the final manuscript. M.D.F. and M.A.P. designed the study field, M.D.F. designed, conducted and supervised the molecular biology studies, interpreted data and drafted the manuscript, K.D. conducted molecular biology studies, M.R. and L.I designed the analytical validation and conducted statistical analyses, V.A. and M.A.P. revised the manuscript.
Authors’ informationAll authors are part of the National Institute of Infectious Diseases – ANLIS “Carlos G. Malbrán”. V.A. (Ph.D) is the Chief of the Virology Department. M.A.P. (Ph.D) is the Chief of the Oncogenic Viruses Service. M.D.F. (Ph.D) coordinates EBV studies in the Oncogenic Viruses Service. M.R. and L.I work in the institutional Operational Team Quality Management. M.R (Biochemist) coordinates the Operational Team Quality Management and has broad experience in laboratory methods validation. L.I. (B.A. in Statistics) is a statistical analysis expert.
The National Institute of Infectious Diseases – ANLIS “Carlos G. Malbrán” is the microbiology technical branch of the Health Ministry of Argentina, and is in permanent contact with regional countries through the Pan American Health Organization (PAHO) interaction. Among other roles, it performs laboratory reference diagnoses, including the development and validation of assays to ensure, via methodological transfer, their availability to any local/regional laboratory that so requires; all these activities are carried out in the framework of the institutional quality assurance programme.
Conflicts of interestThe authors declare no conflicts of interests.
Financial supportThis project was partially supported by grants from ANLIS Carlos G. Malbrán (FOCANLIS/2009) (Buenos Aires, Argentina).
The authors are indebted to J. Campos and S. Nuñez for their technical assistance, Drs. C. Gonzalez Cambaceres, P. Bernáldez, M.T. García de Dávila, J. Ibañez and A. Turconi (“Prof. Dr Juan P. Garrahan” Pediatric Hospital); J. Gregoresky and M. V. Ávila (Austral University Hospital); T. Gonzalez and S. Besga (“Sor María Ludovica” Children's Hospital), J. Trentadue (Favaloro Foundation) and N. Zala and S. Camino (“J. F. Muñiz” Infectious Diseases Hospital) for their generous help during sampling and their commitment to the prevention of PTLD in transplant patients.
