
Hypovitaminosis D is now considered a pandemic, especially among more vulnerable populations and in HIV-infected subjects, with 80% presenting levels below 30 ng/mL. As there is no consensus on the more adequate dosage needed to correct such deficiency, the objective of this study was to evaluate 25 (OH) vitamin D supplementation in HIV-1 patients deficient of vitamin D. A total of 73 HIV-1-infected patients were included, drawn from a cohort of 435 patients; 37 patients were randomized to the active group, supplemented once a week with 50,000 UI vitamin D by mouth (group 1) and 36 to the placebo group (group 2). The study period ranged from June 2016 to September 2017. Variables involved in vitamin D metabolism and risk factors associated with hypovitaminosis were evaluated. The mean age was 45 years and 31.5 % were women. Vitamin D supplementation was effective in normalizing serum levels after six months in group 1 (mean 35 ng/mL compared to 21 ng/mL for the placebo group; p = 0.04). No patient reached blood levels considered toxic (>100 UI). Efavirenz use can negatively influence vitamin D levels and supplementation is necessary as a likely adjunct to improving CD4+ T cells, resulting in greater effectiveness of the treatment. A weekly oral dose of 50,000 IU of vitamin D was sufficient to normalize the vitamin deficiency, safely and with good adherence among persons living with HIV/AIDS in Brazil.
Vitamin D, a steroid hormone, is a liposoluble molecule present in almost all tissues, such as brain, pancreatic islets, bones, skeletal muscles, kidneys, intestine, skin, parathyroid glands, pituitary, breast, lymphocytes and monocytes. It is involved in macrophage-monocyte differentiation, cell proliferation and immunomodulation.1–3 Vitamin D deficiency shot up with the industrial revolution, leading to rickets in children and osteomalacia in adults.2 Low dietary intake, low sun exposure, reduced intestinal absorption and renal 1-hydroxylase activity, as well as use of drugs interfering with vitamin D metabolism are associated with the deficiency. In persons living with HIV/AIDS (PLWHA), the occurrence of opportunistic diseases and the introduction of antiretrovirals may further deepen an already existing state of vitamin D deficiency.2
Tenofovir disoproxil fumarate (TDF) is an antiretroviral that may affect bone mineral density (BMD) and nowadays TDF with emtricitabine (TDF/FTC) is also used for HIV pre‐exposure prophylaxis (PrEP). A study evaluated the effect of supplementation of vitamin D and calcium in Thai youths, resulting in an increased mineral density in lumbar spine bone over six months.4 Acknowledging vitamin D functions, including its role as a hormone, makes clear that its deficiency implies risk for osteopenia and osteoporosis.5 We found an 80% prevalence of vitamin D deficiency among our HIV-1-infected patients.6 Currently, there is no consensus about the protocol that should be used for HIV-1-infected patients with vitamin D deficiency in tropical countries, such as Brazil. Therefore, we designed this supplementation study for patients who have been followed-up for 20 years in our service in São Paulo city.
MethodsA multidisciplinary care for persons living with HIV/AIDS (PLWHA) was implemented in our outpatient service (ADEE3002), where over 1200 patients have already been cared for since its inception in 1983. 435 (36.3%) of those patients were still in active follow-up by December 31th, 2019. All patients whose vitamin D blood levels were in the range of 10–30 ng/mL were invited to participate during their regular appointments; those who agreed to participate were then randomized. Patients included in the study signed a free and informed consent form. The study was approved by the Hospital das Clinical Ethical Board, CAAE number 53612215.5.0000.0068. Patients included were adult HIV-1-infected subjects under active follow-up, regardless of cART regimen, 68.5% men. Pregnancy or inability to understand the informed consent form were exclusion criteria.
This study was a randomized, double-blind, controlled clinical trial evaluating the efficacy of vitamin D3 supplementation, as well as its influence on blood parameters associated with bone metabolism, in HIV patients. To be included, patients should have 25-hydroxyvitamin D blood levels between 10 ng/mL and 30 ng/mL, considered as vitamin D insufficient. Participants in group 1 were supplemented with weekly 5000 IU of vitamin D for six months; controls received placebo capsules identical in appearance and with the same schedule as participants in the active arm. Randomization was carried out through a random numbers table, obtained on the internet site random.org. A team member was assigned to determine which of the two randomized groups would receive vitamin D or placebo. All volunteers were asked to go to the clinic to receive the capsules in a dedicated visit; capsules were delivered by team members. Capsule intake instructions forms were also delivered, as well as a recommendation to be exposed to sunlight, without sunscreen, for at least 15 min three times a week.7
After a six-month period, tests of 1,25 vitamin D, PTH, total calcium, ionic calcium, glucose, urea, creatinine, osteocalcin, and propeptide of procollagen type 1 (P1NP) for both groups were analyzed and compared. Participants were followed for six months, performing laboratory tests every three months. Tests of bone metabolism were performed in three moments: before supplementation and after three and six months; tests included dosage of PTH, osteocalcin, P1NP amino terminal, C-terminal telopeptide (CTX). Renal function was also monitored with urea and creatinine tests, as well as blood glucose, total and ionized calcium. Urine tests included calcium/creatinine and phosphorus/creatinine ratios in order to evaluate calciuria and renal function, respectively. We also controlled for possible confounders such as age, sex, race, body mass index (BMI), smoking, sun exposure, CD4+ T cells count, HIV plasma viral load and use of antiretrovirals, such as tenofovir and efavirenz.
Statistical analysisAt first, a descriptive analysis of the results were performed in order to elaborate graphs and frequency tables, with the purpose of characterizing the sample. Frequencies and percentages were calculated for categorical variables. Graphs displaying the average profiles of laboratory tests results obtained before and after the intervention for each group were drawn; on the graphs, each line corresponds to one subject whereas the points correspond to the tests results obtained before and after the intervention. Test results are presented as absolute number, arithmetic mean and standard deviation.
The study results wereanalyzed using an adjusted mixed linear model, the outcome variables being the laboratory tests results and the predictor variables the sociodemographic characteristics, treatment group and the evaluating time. We considered the structure of the composed symmetrical variance, where two measures of the same individuals are equally correlated, no matter how distant in time the measures were taken. The model was adjusted by the maximal likelihood method, implemented on the function lmer of the lme4 package (BATES et al., 2007), from the statistical environment R (R Development Core Team), 3.3.1. version.
The inclusion of random effects was evaluated by the comparison between models with and without the variance parameter by means of the likelihood ratio test, which showed that the random effect contributed significantly to all models. We built tables of the deviance type III analysis to evaluate fixed effects.
Pearsons's correlation test (1986) was used to evaluate the relationship between variables. To interpret the magnitude of the correlations the following classification was adopted (Sicsú and Dana 2012): weak: <0.3; moderate: 0.3<<0.7; strong: >0.7. The significance of statistical tests results were set at 5%; all analyses were performed with the aid of the statistical environment R (R Development Core Team), version 3.3.1.
ResultsA total of 73 patients were recruited for this study, 37 for the active group and 36 for the placebo group. 68.5% were men, mean age 45 years old, 71.2% white, and mean follow-up time 10 years. Vitamin D levels went from a mean of 21–35 ng/mL (p = 0.04) for the active group, and as expected, levels for the placebo group kept unchanged (21 vs 21 ng/mL). There was statistically significant association of vitamin D blood levels with ethnicity, age, calcium, glucose, renal function, or urinary excretion of potassium, creatinine, calcium, and body mass index. In contrast, smoking was associated with lower blood levels (Table 1). Supplemented active group achieved a small increase in T CD4+ lymphocytes at the end of the six-month follow-up time, compared to the placebo group (p = 0.05) (Table 2). We found a negative association between vitamin D blood levels and efavirenz use, but not with tenofovir use. All patients reported, in their responses to questionnaires, similar sun exposure during the different seasons.
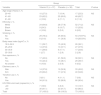
Demographic characteristics of the HIV-1-infected with vitamin D supplementation with 50,000 IU/week to the active group compared to placebo group.
NS = non-significant (p > 0.05); Normal vitamin D levels: Values higher than nine and below 30 ng/mL.
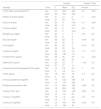
Laboratory results pre- and post-vitamin D supplementation among HIV patients in this study (group 1 only).
Notes: CA: Calcium; Cr: Creatinine; CTX: carboxy-terminal collagen crosslinks; P1NP: Total procollagen type 1 N-terminal propeptide; SD: standard deviation; Uri: Urinary.
As expected, there was a significant increase in vitamin D blood levels in the supplemented patients as compared to controls, reaching normal range after six months of treatment. Supplementation was safe at the dosage of 50,000 IU, no patient exceeding what is considered the maximum reference of 100 ng/mL.8 Similar results were reported in a study with 44 HIV-infected individuals aged between 8.3 and 24.9 years, who received daily doses ranging a minimum of 4,000 IU, and obtained 80% efficacy.9 Rheumatoid arthritis patients have been safely treated with doses of up to 100,000 IU vitamin D weekly and with positive results on the inflammatory process and a gradual increase of skeletal calcium.10,11 In this study, only 5% of our supplemented patients did not reach satisfactory blood levels of 1,25 vitamin D, which may be attributed to organic factors, such as polymorphisms in the vitamin D receptor hindering normalization of levels.12 In the general population, in a study that supplemented institutionalized elderly with 25,000 UI weekly also reported a safe and effective result, with 84% of the group treated with vitamin D and sun exposure obtaining increases in vitamin D levels after four weeks.13 In contrast, 58% of the supplemented institutionalized elderly patients who used 50,000 IU weekly did not reach levels considered normal after eight weeks of treatment,14 suggesting that time may be important as an adjuvant for efficacy. Our results are similar to those from another study conducted in Sao Paulo city with psoriasis and vitiligo patients, who received 35,000 IU daily for six months.15
As expected, vitamin D supplementation also helped preventing calcium loss. Controls had a tendency to increase PTH and reduce urinary calcium, unlike patients in the supplemented group, whose 1,25 vitamin D levels increased significantly. There was a non-significant tendency of increase in phosphorus in the supplemented group and reduction in the placebo group, which is a joint measure with total calcium and PTH; the correlation of vitamin D with phosphorus, calcium and ionic calcium was not positive. It is known that vitamin D production is regulated by the production of PTH, which in turn is regulated by serum calcium levels. We found a negative association of smoking habit and the use of efavirenz on vitamin D levels, suggesting that vitamin D supplementation can be a valuable adjuvant of the treatment of HIV infection for smokers and/or for those receiving that inhibitor of reverse transcriptase. However, in order to confirm our findings, further studies including larger numbers of patients should be carried out.
In summary, vitamin D supplementation was effective to normalize blood levels after six months (>30 ng/mL) for 80% of the patients of this study. No patient presented blood levels considered dangerous (>100 ng/mL). A weekly dose of 50,000 IU of vitamin D orally was sufficient to normalize the vitamin deficiency safely and with good adherence among HIV-1-infected subjects in Sao Paulo city. We believe that our data will be important to update Brazilian guidelines for vitamin D supplementation. Further studies should be conducted to assess the incidence of bone mineral disease, including fractures, since HIV/AIDS patients are growing older. Finally, we found that cholecalciferol (vitamin D3) supplementation was efficacious to attaining blood levels considered normal for 80% of the patients, after six months of treatment.
Authors: *Grupo do Ambulatório de Imunodeficiências Secundárias (ADEE3002) do Hospital das Clínicas, Serviço de Dermatologia/Faculdade de Medicina – LIM56/Instituto de Medicina Tropical de São Paulo/Universidade de São Paulo: Jorge Casseb; Ana Paula R. Veiga; Marcello M. C. Magri; Mariana A. Monteiro; Rosana C. Rocha; Maria R. P. Gascon; Mauricio D. Ferreira; Thales J. B. Polis; Najara A. de Lima Nascimento; Gabriela Prandi Caetano; Ícaro S. Oliveira; Luiz A. M. Fonseca and Alberto J. S. Duarte.
We dedicate this work to all patients who attended our service along the last 30 years and to ex-medical residents who cared for them. We also thank the volunteers Maria Olímpia Ribeiro Freitas and Maria Tereza de Figueiredo, who for more than 20 years worked at the ADEEE3002 HIV outpatient service, Hospital das Clínicas, Faculdade de Medicina USP.
Support: FAPESP no. 2018/07239-2; CNPq: no. 301275/2019-0; and Scholarship from FFM/FMUSP to JC.
